Siemens TIA Portal PLC Dashboard using Node-RED: A Step-by-Step Tutorial
Introduction
In industrial automation, the ability to seamlessly interface physical machinery with digital control systems has become a critical asset for optimizing processes and enhancing efficiency.
This tutorial explores Node-RED, a versatile platform, to create a Siemens PLC dashboard. Whether you're new or experienced, this guide simplifies the process. By the end, you'll construct a real-time dashboard connecting seamlessly to your Siemens PLC, streamlining operations and showcasing the power of digitalization.
Prerequisites
To follow this tutorial, you will need an installation of Node-RED, TIA Portal, and
NetToPLCsim. You can use any version. No additional hardware or software is required.
Installing Node-Red
Now that we're ready to embark on this journey of automation and digitalization let's start by setting up Node-RED. If you haven't installed it already, don't worry; we'll guide you through the process step by step.
Step 1 - Downloading & Installing Node.js
Visit Node.js and download the Long Terms Stable (LTS) software release. Node.js is a runtime environment upon which Node-Red has been built.
Once it has finished downloading, install it on your computer.
Step 2 - Installing Node-Red
Installing Node-RED by using your CMD run
npm install -g --unsafe-perm node-red
This command magically sets up Node-RED on your system.

Step 3 - Running Node-Red
Run Node-red by run node-red command in CMD (don’t close the CMD while server running).

Now, you can access Node-Red by visiting http://127.0.0.1:1880/ or http://localhost:1880/ in your web browser.
TIA Portal side - Configurations and program
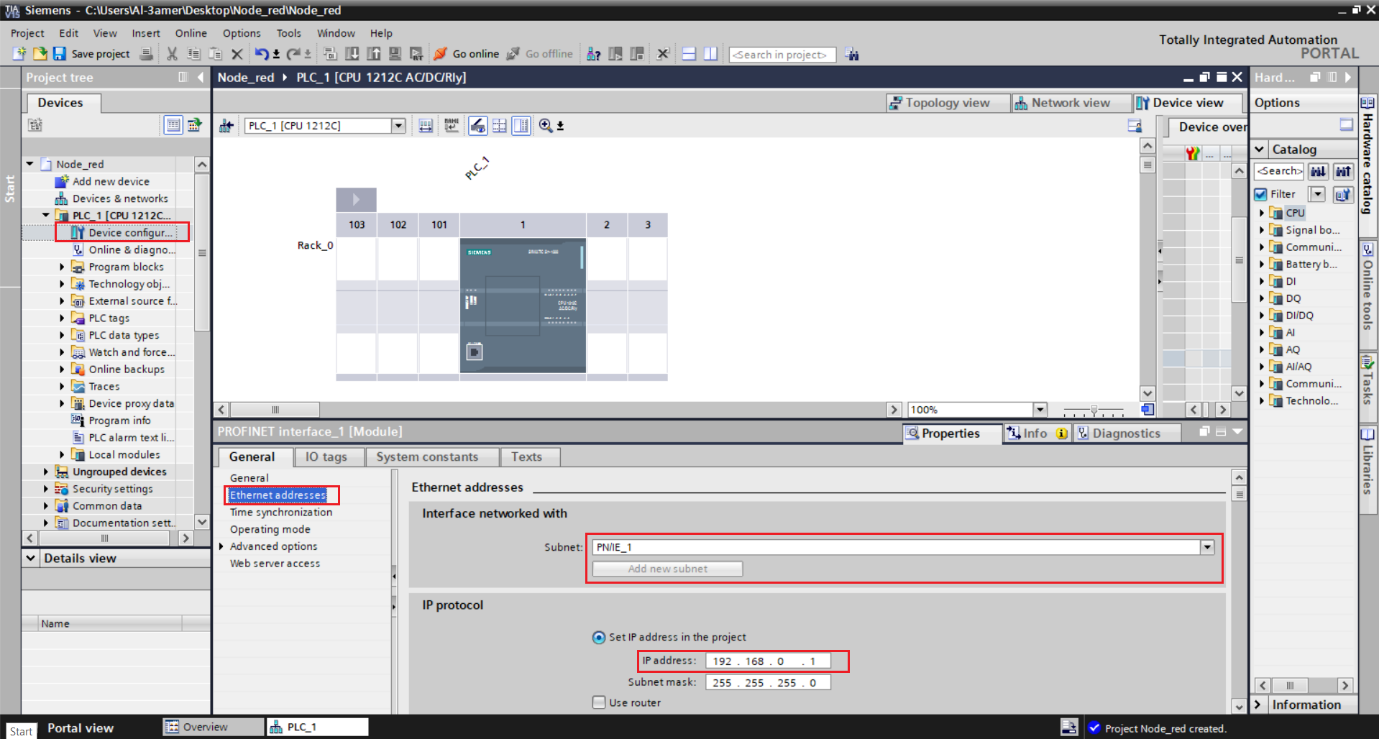
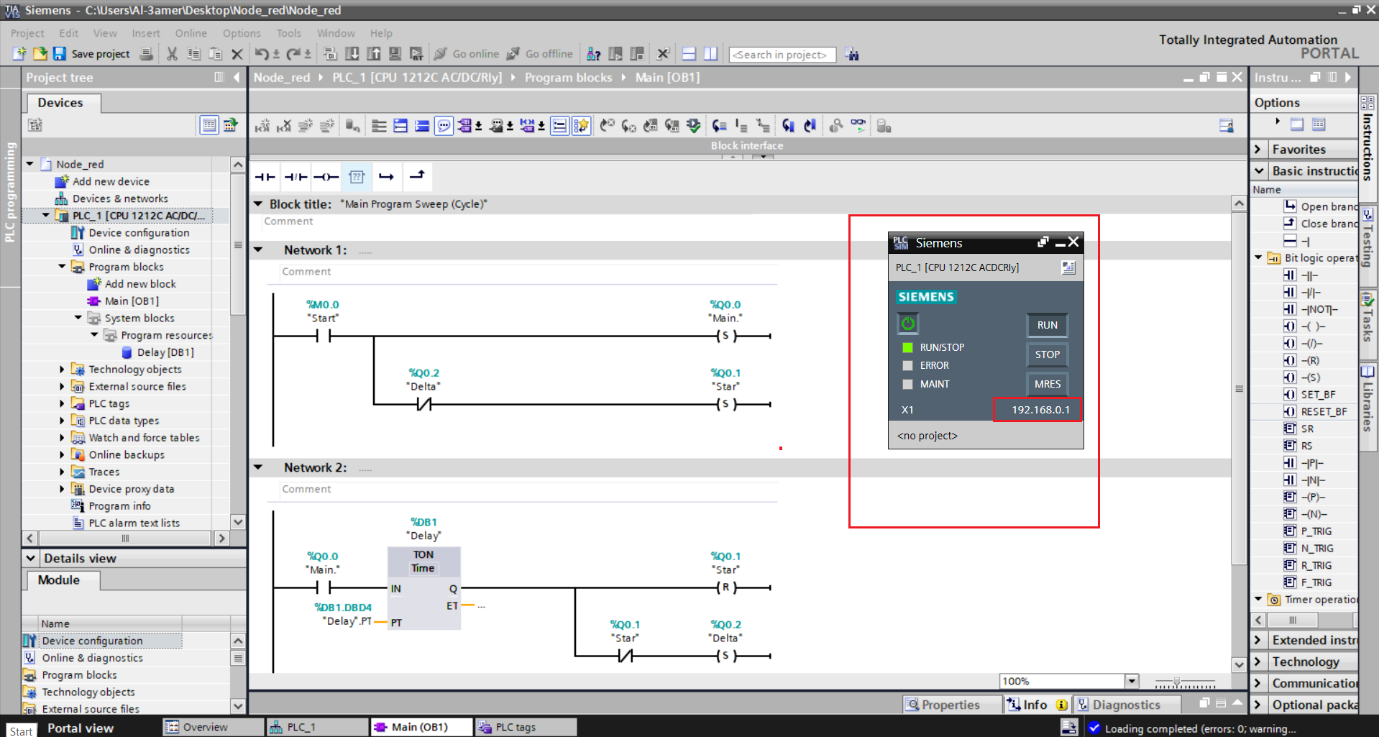
Let’s start by creating a TIA Portal project containing a CPU of your choice. Here we will use a 1212C CPU (6ES7 212-1BE40-0XB0). The IP address of the CPU is configured to 192.168.0.1. Later in the tutorial, we will use a Net-To-PLC-sim instance to simulate this station.
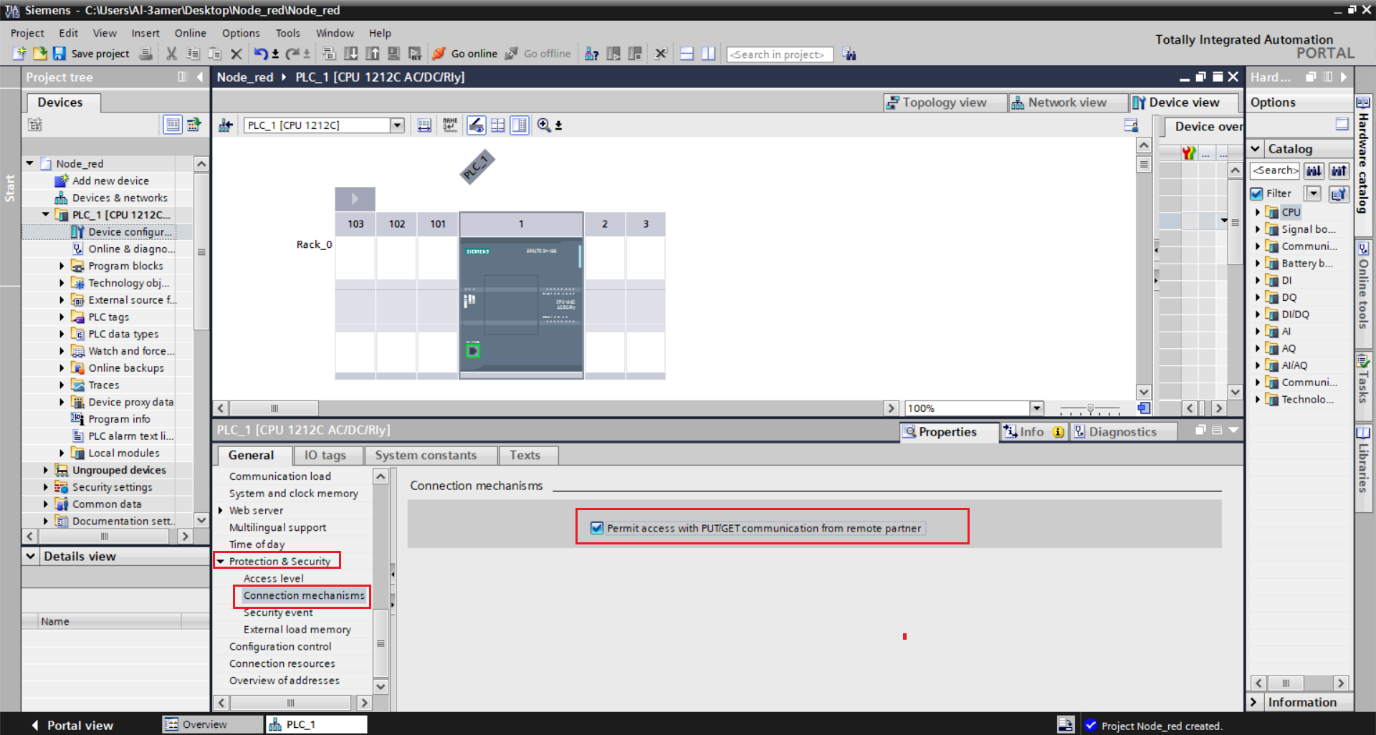
We will use a package with the S7 communication protocol on the Node-RED side. So we need to activate the “Permit access with PUT/GET communication from remote partner” option.
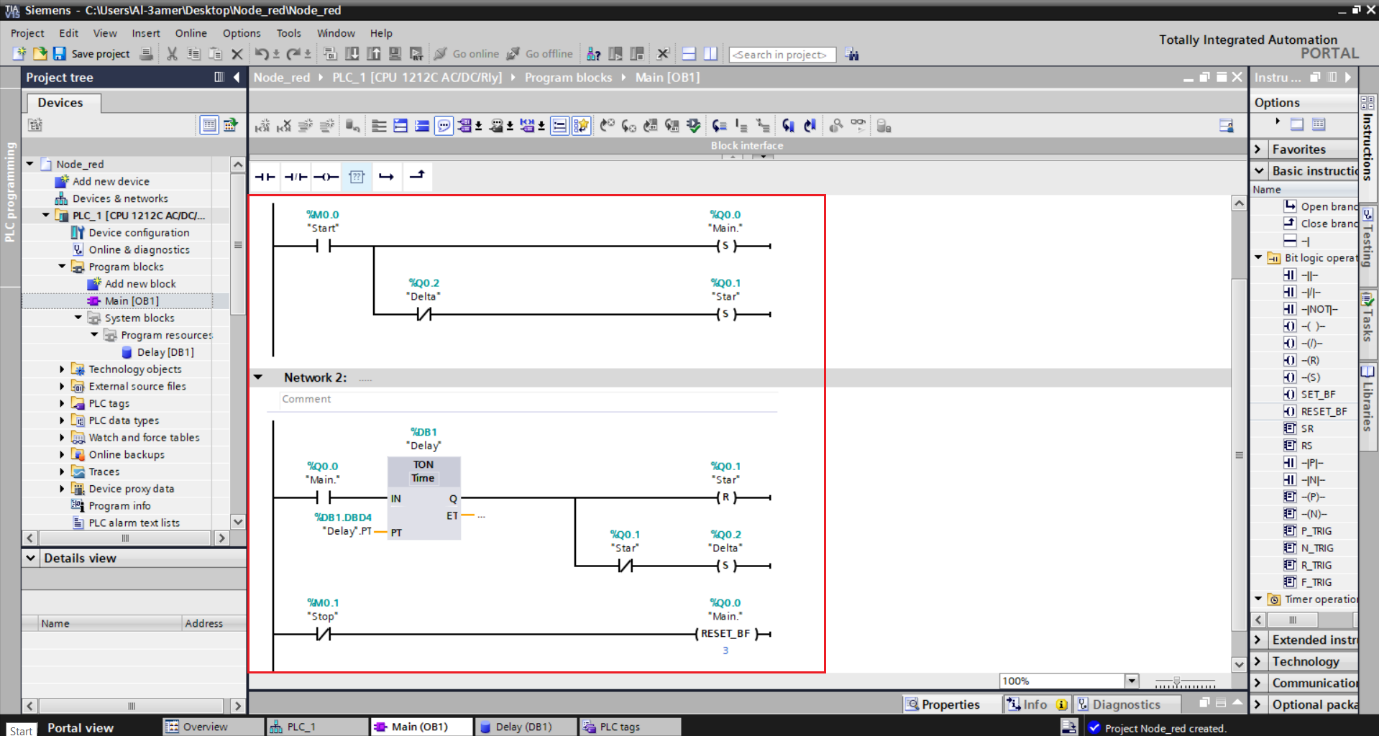
To create a dashboard using Node-RED, we will utilize the following small program for the star-delta starting method of a motor.
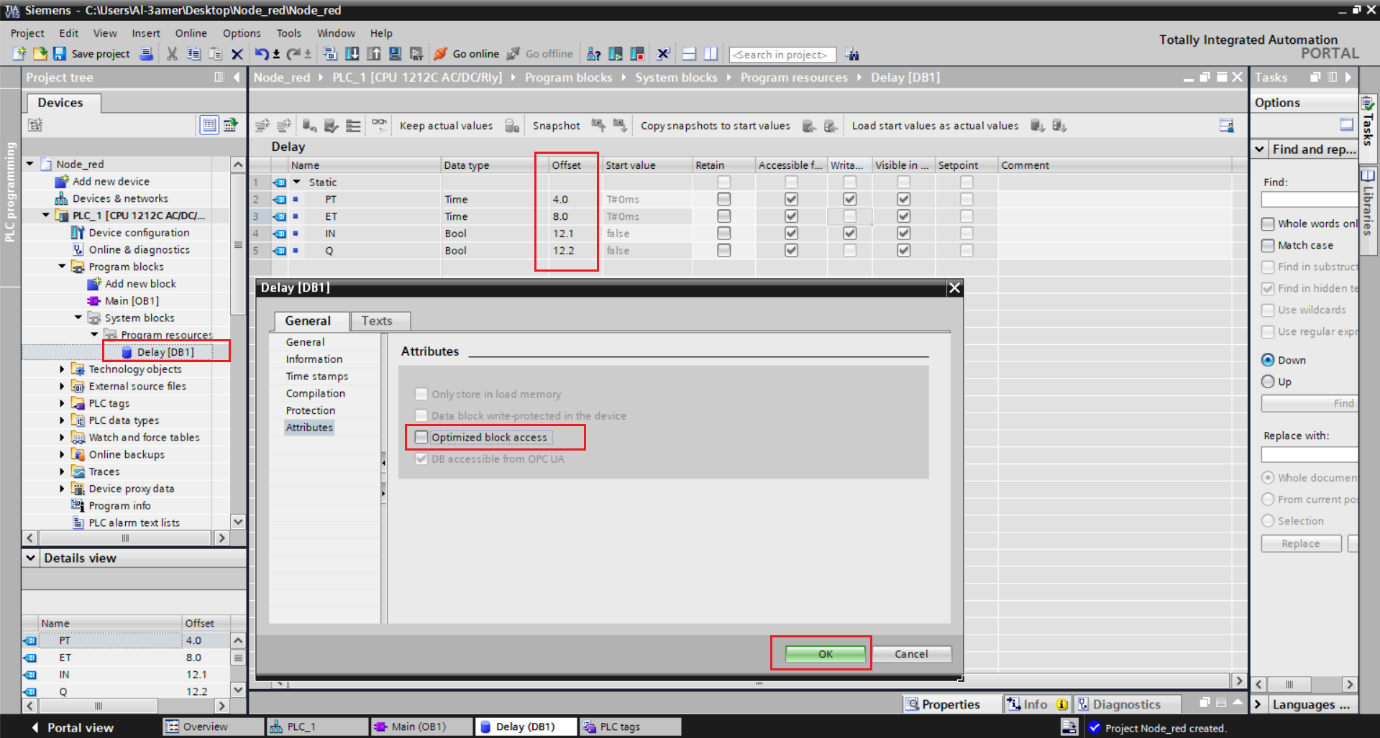
Also, we need to turn off the data block optimization for this DB of timer to be able to access it from Node-RED to read using each element’s offset.
Net-To-PLC-sim side – Configurations
Start simulation in TIA Portal
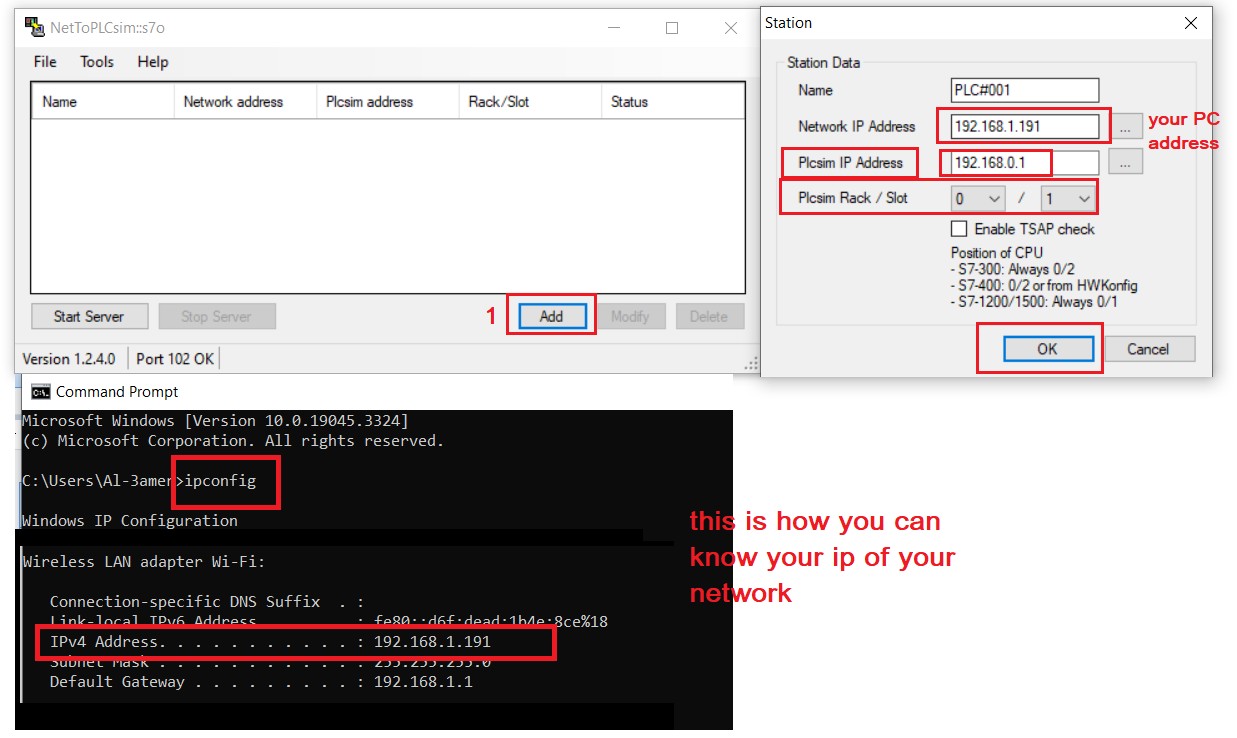
Net-To-PLC-sim is a software-based PLC simulator primarily used for educational and testing purposes. It emulates the behavior of Siemens S7-PLCs, allowing users to simulate and test control programs without the need for physical hardware.
Open Net-To-PLC-sim as administrator.
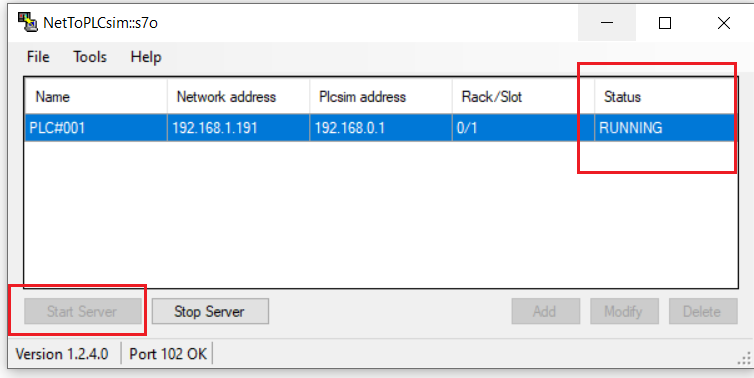
Now, start your server, and we are done!
Node-RED side – Configurations
Now, let’s head to the Node-RED side. Node-RED works with a graphical language where you link blocks called "nodes" to perform different operations. Here, we will use a library (or “Palette”) that handles S7 communications directly and connect them to other nodes to send or retrieve data for showing in our dashboard.
Open Node-RED on your web browser. We need first to install the S7Comm, dashboard, and led palettes. Open the options on the left and click on “Manage palette.”
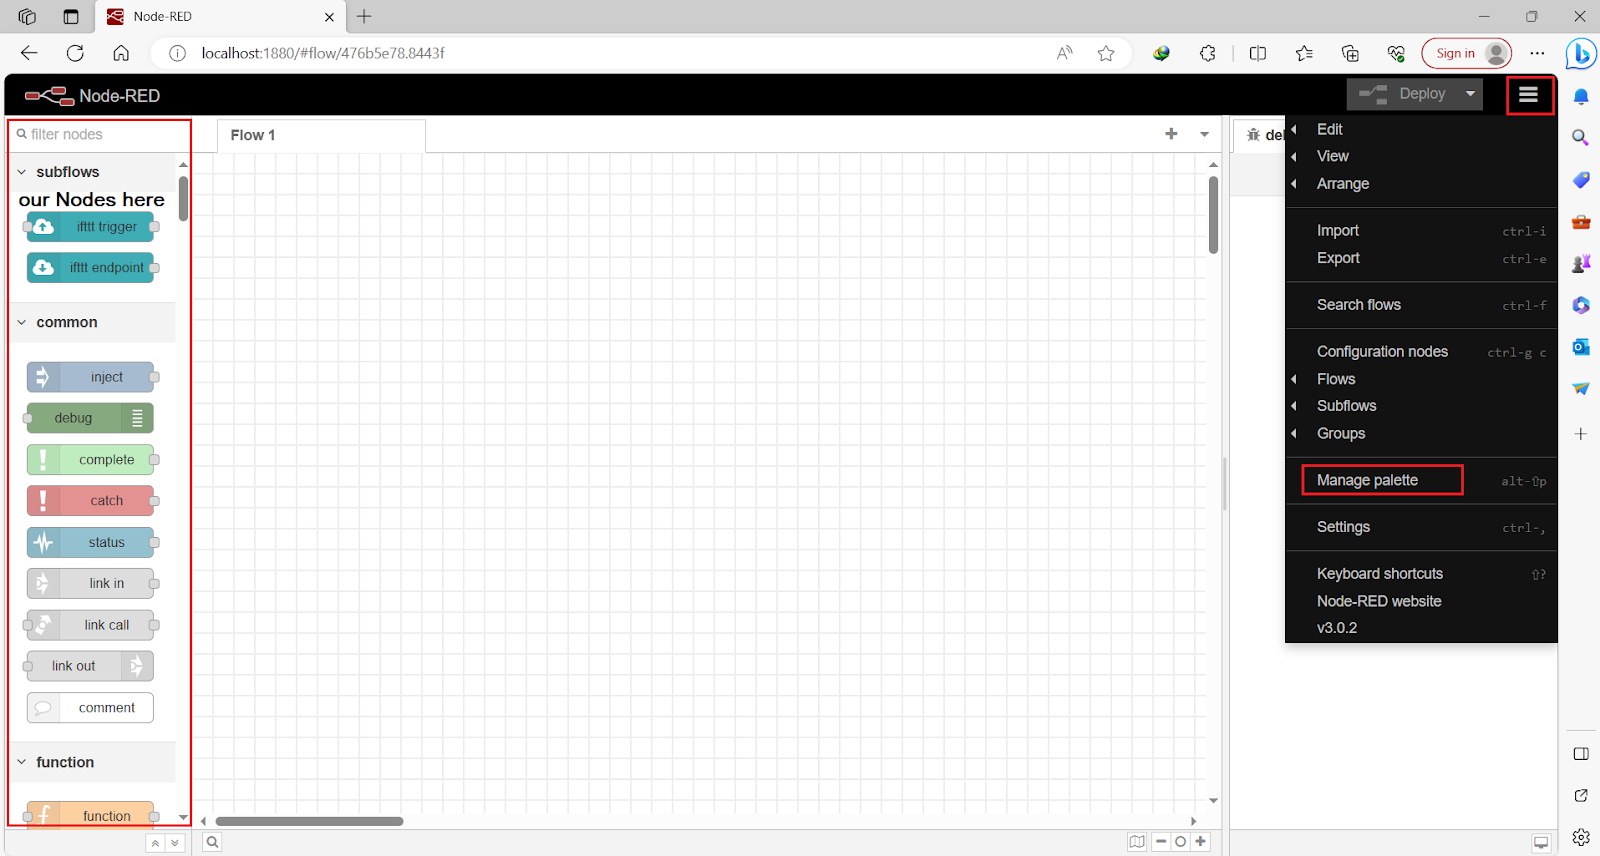
To install a palette, open the “Install” tab and type the name of the palette you are looking for. In our case, you will install these three palettes.
node-red-contrib-s7comm / node-red-dashboard / node-red-contrib-ui-led
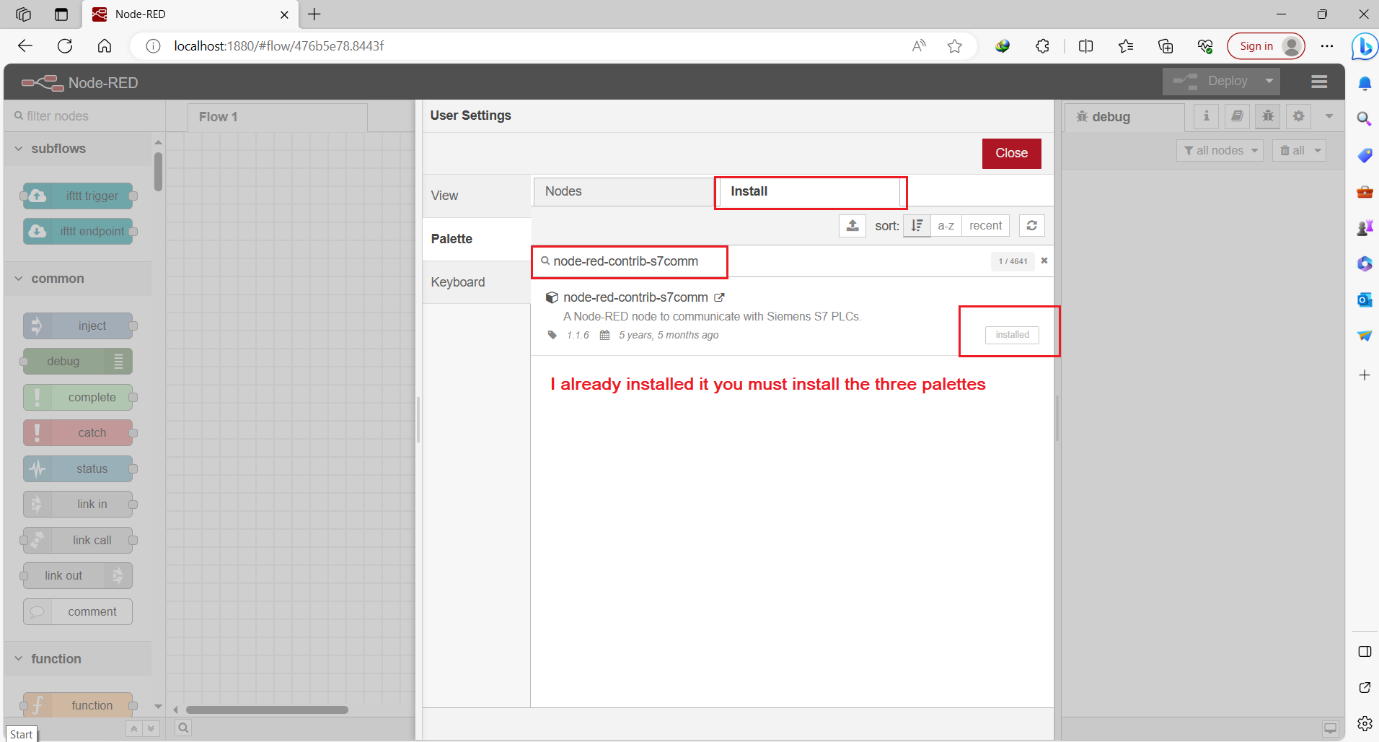
After installing the three palettes, you will find them in the list of your nodes. Let's start with S7Comm nodes to read/write data from the PLC.
Node-RED side – S7Comm Configurations
You can find S7Comm nodes in input and output. The input node is for read, and the output node is for write.

Double-click on either of the two nodes to modify its configuration.
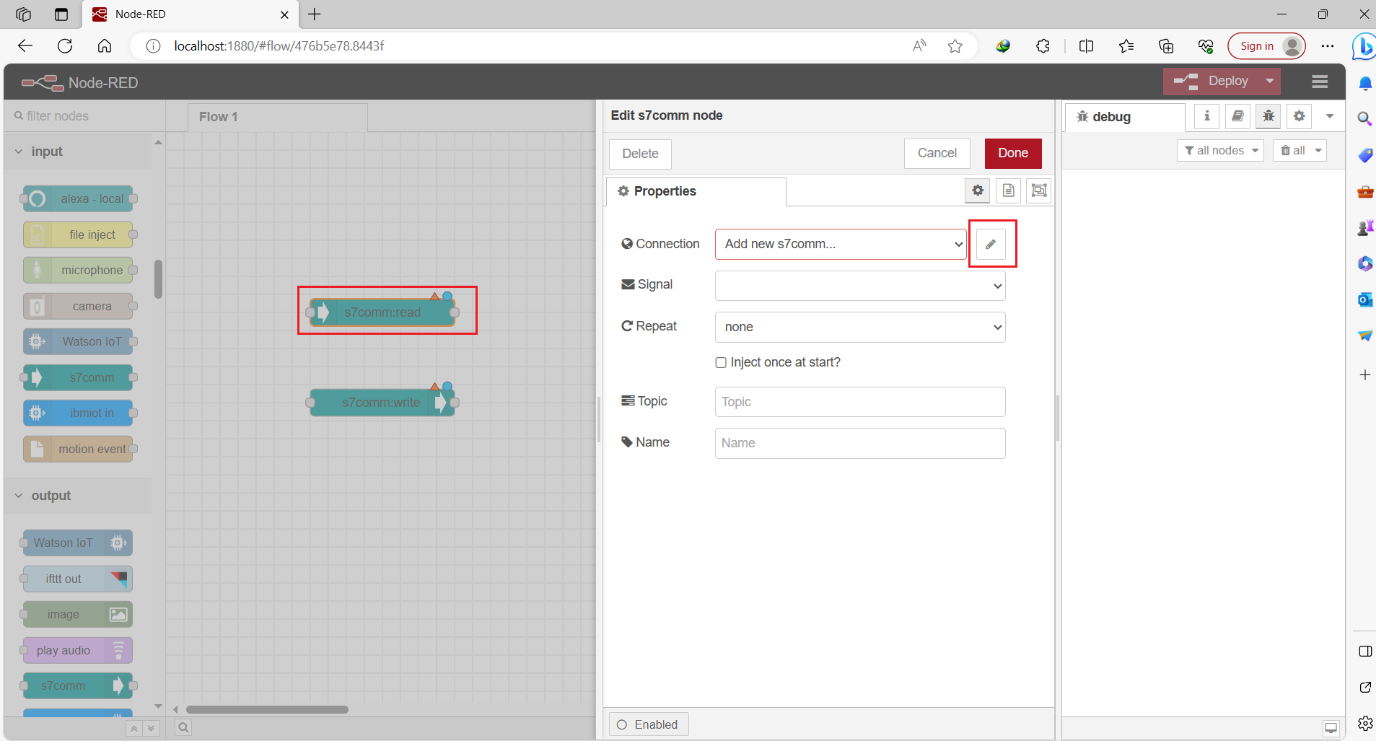
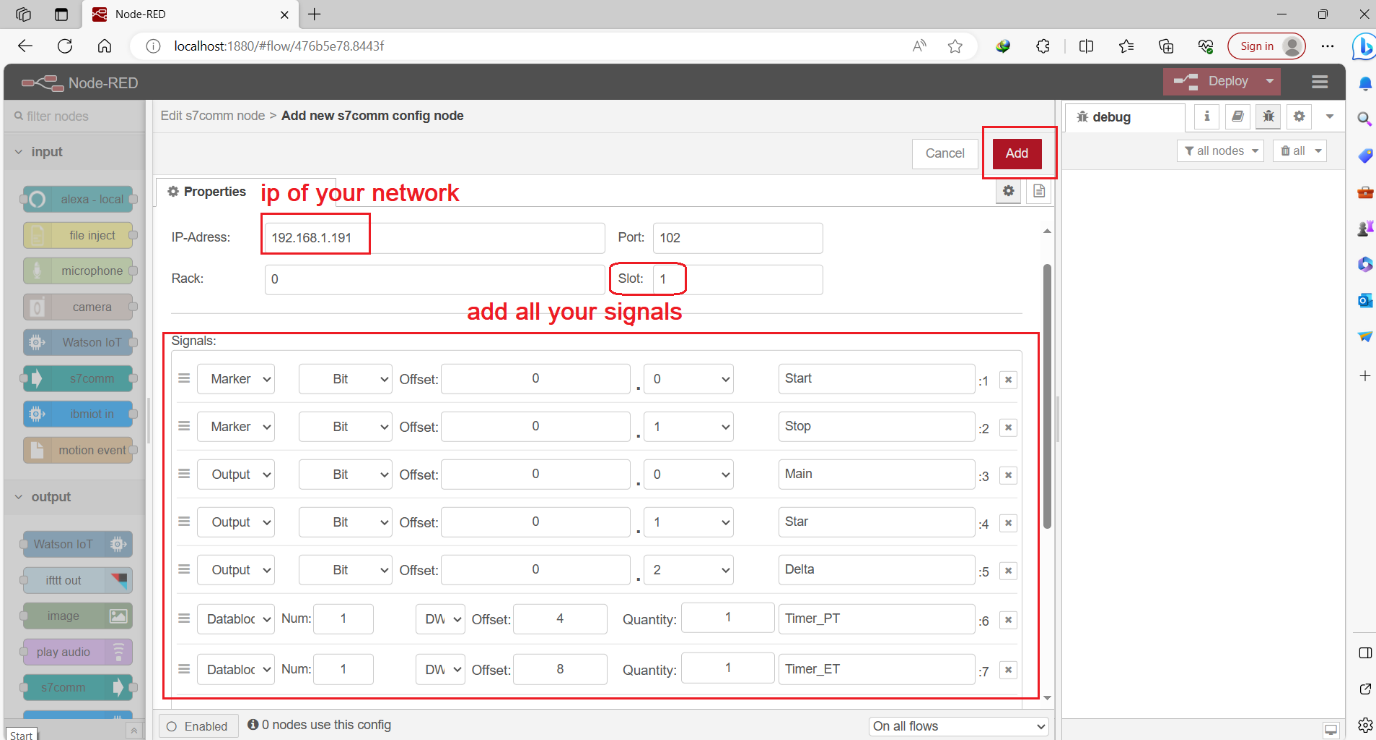
Now, add the IP address of your network and the necessary tags for reading or writing.
Select the signal type, specify the offset, and give it a name. For example, I've added the Timer PT and Timer ET from the DB of Timer I. Since there is no 'Time' data type available, I selected the 'Dword' data type for both after finishing clicking on Add.
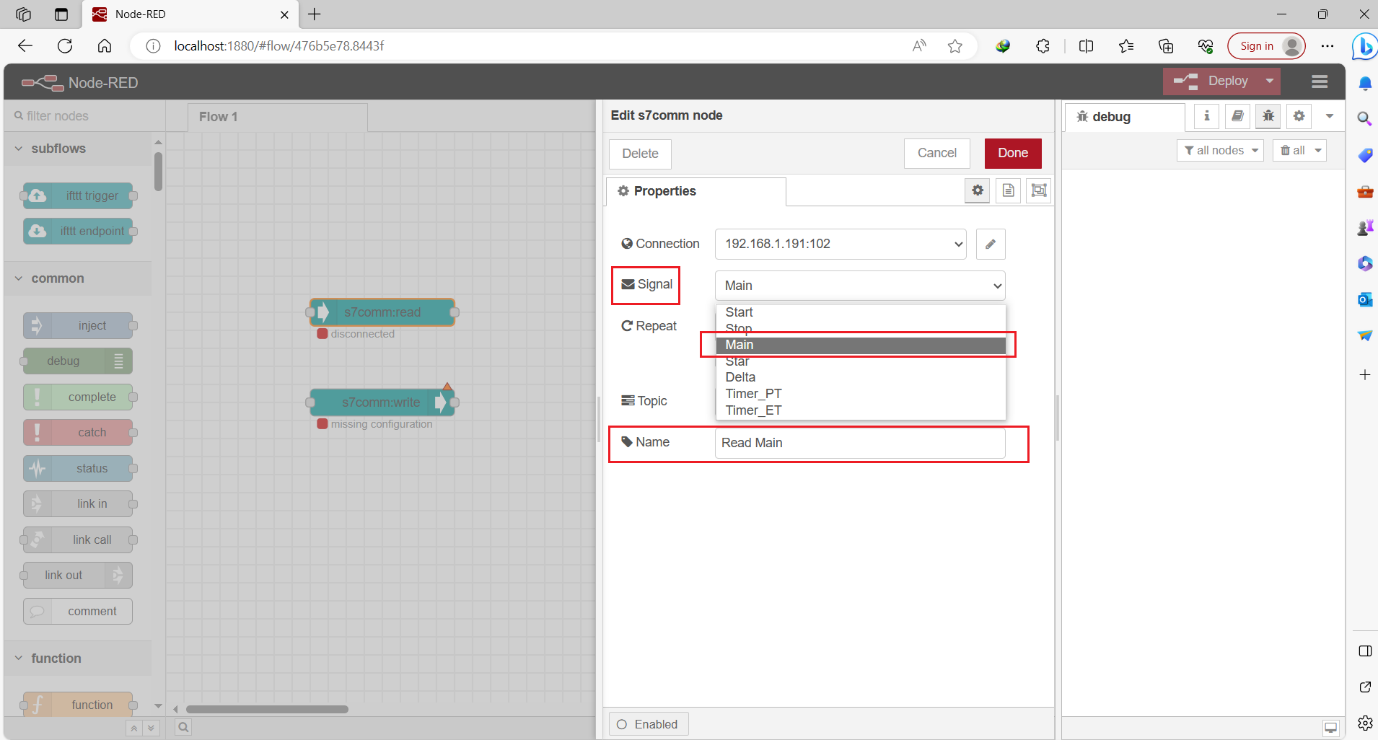
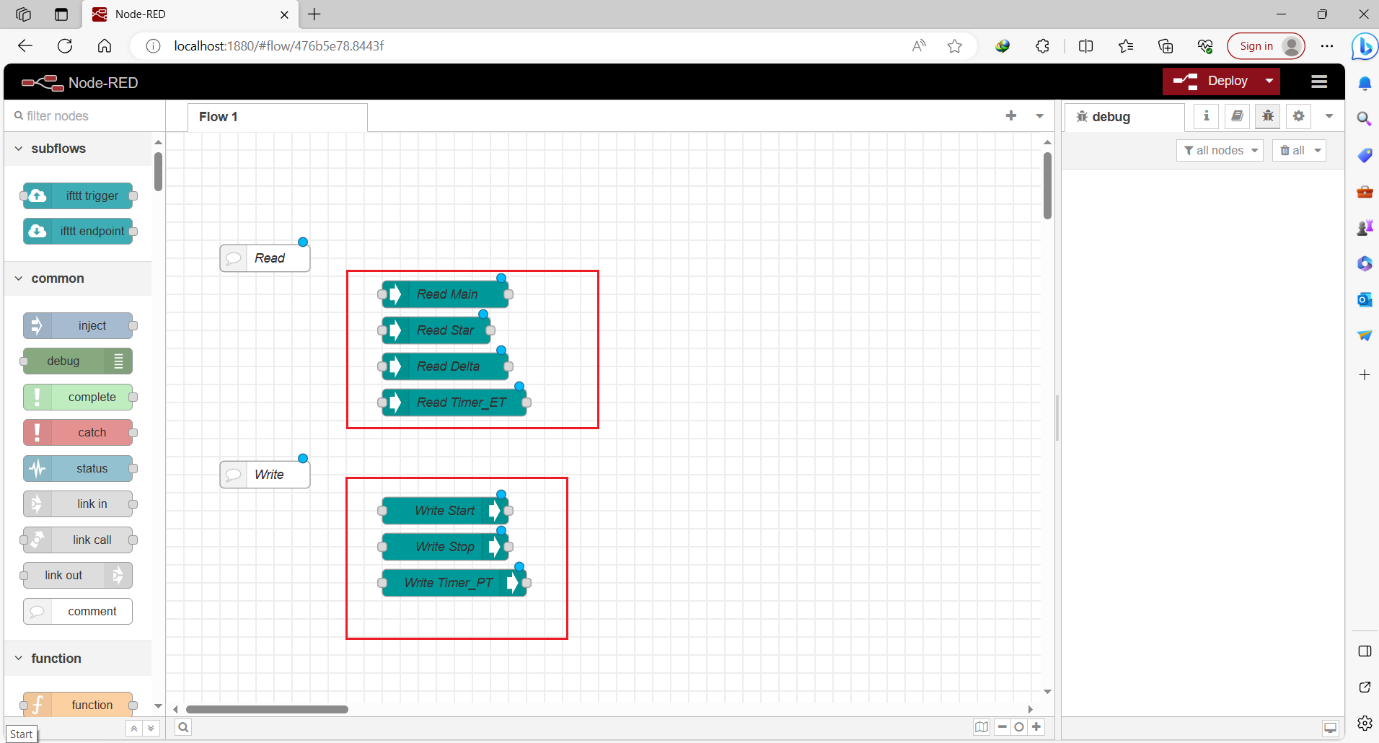
Next, we will select our signal which we want to read or write. In our case, we want to read the state of Main, Star, Delta, and Timer ET. Also, we want to write on Start, Stop, and Timer PT.
Let's begin by selecting our first signal to read and assigning a suitable name to the corresponding node.
Now, let's configure the settings for reading and writing all signals. I've added 4 S7comm read nodes to read our four signals and 3 S7comm write nodes to transmit data to our chosen 3 signals, as shown in the figure.
Node-RED side – S7Comm Read node Programming
Now, let's explore how we can read from or write to the PLC. As you can see, each node has both an input and an output. To activate the input and obtain an output, we'll use an inject node. This inject node will send signals to our S7Comm nodes, prompting them to run.
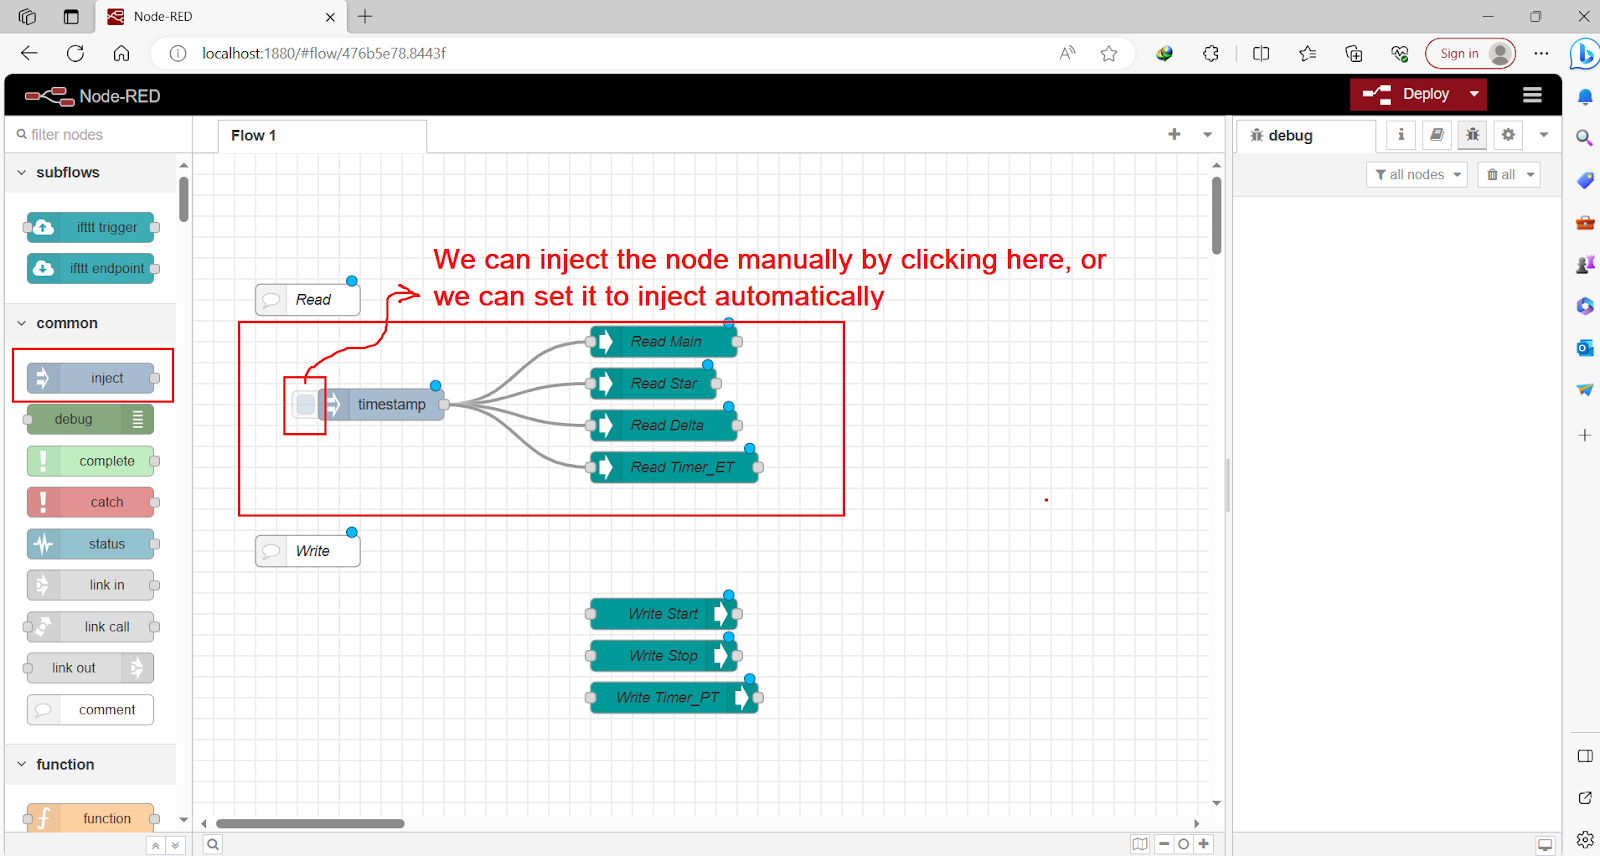
We want to read data from the PLC automatically, so let's configure the inject node to send signals to activate the inputs of the S7comm nodes. Double-click on the inject node, and I will choose to send data to activate my inputs of the S7comm nodes every 1 second and select Done. Let's not make it less than 1 second to minimize network traffic.

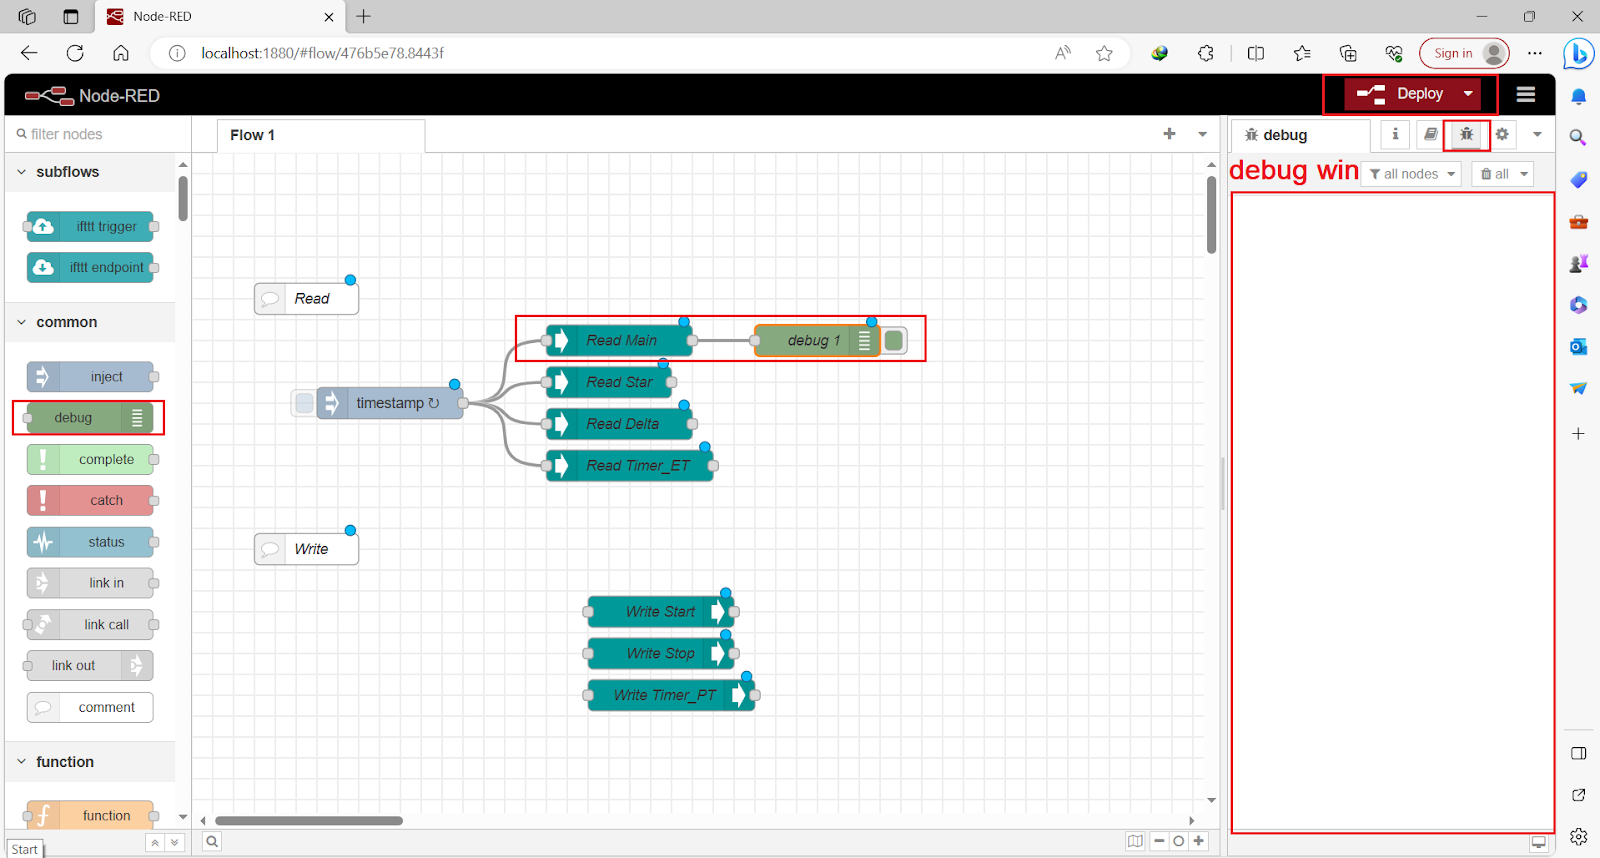
Now that we can read a tag, it's essential to take some action with it. For instance, we can display it in the Node-RED debug window. To do this, let's add a 'debug' node to the workspace and connect it to the output of the S7comm node. This will show the state of the tag in the debug window. Don't forget to click 'Deploy' after finishing all the settings we've configured.
Now we can see all nodes are connected and we get the state of Main tag every 1 sec shown in the Debug windows.
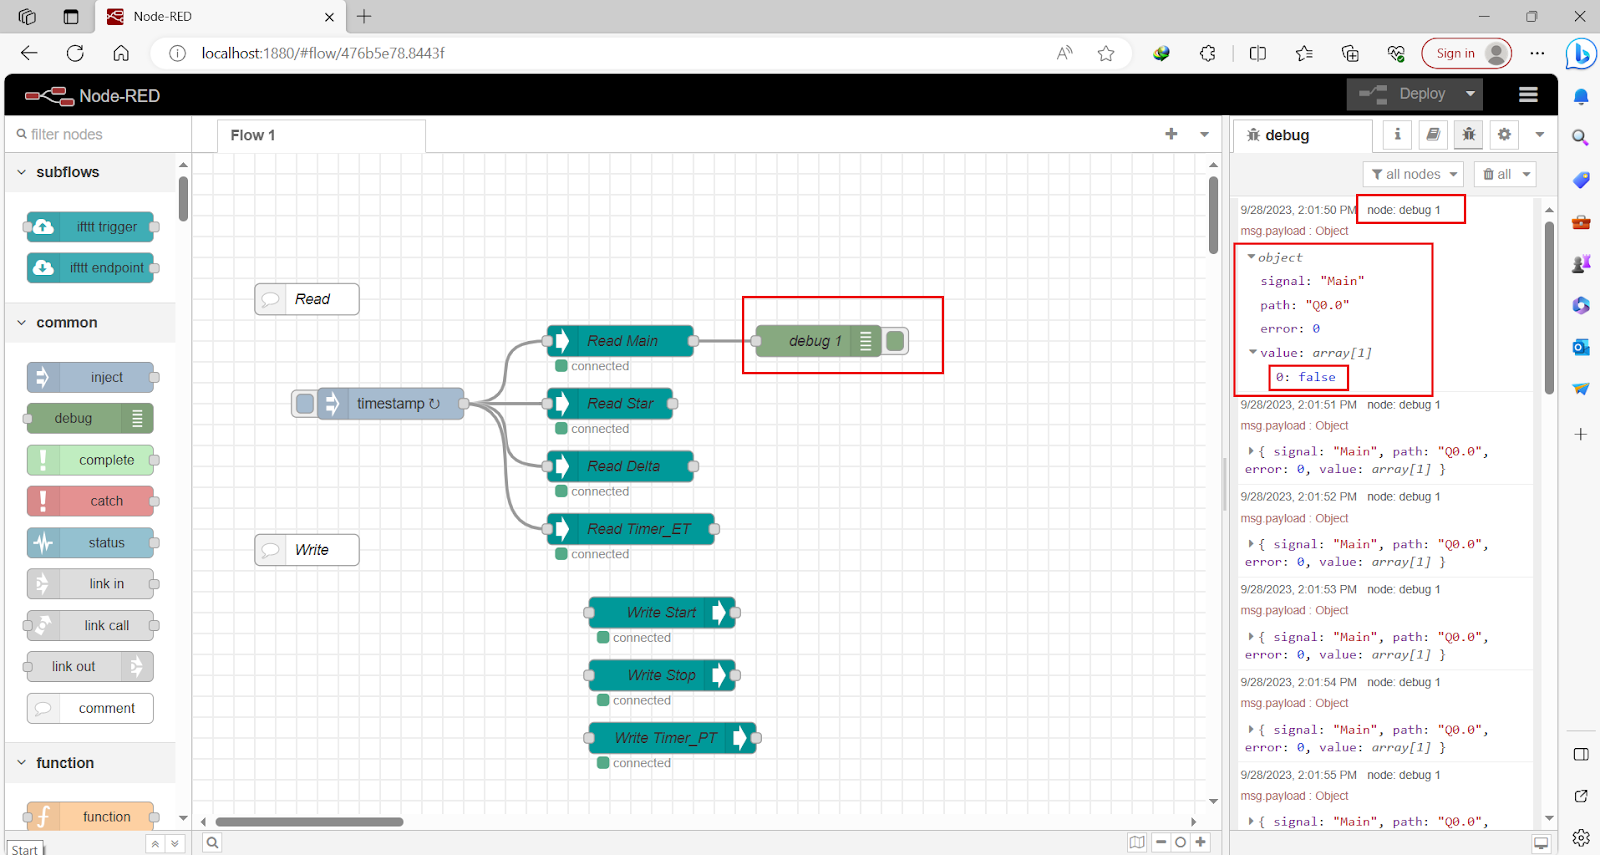
We get the full information about the tag but we want only the value of the tag. We don't need other information so let’s get the path of the value.
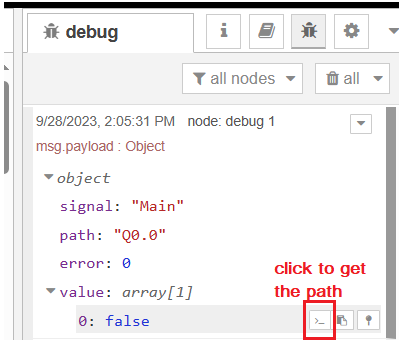
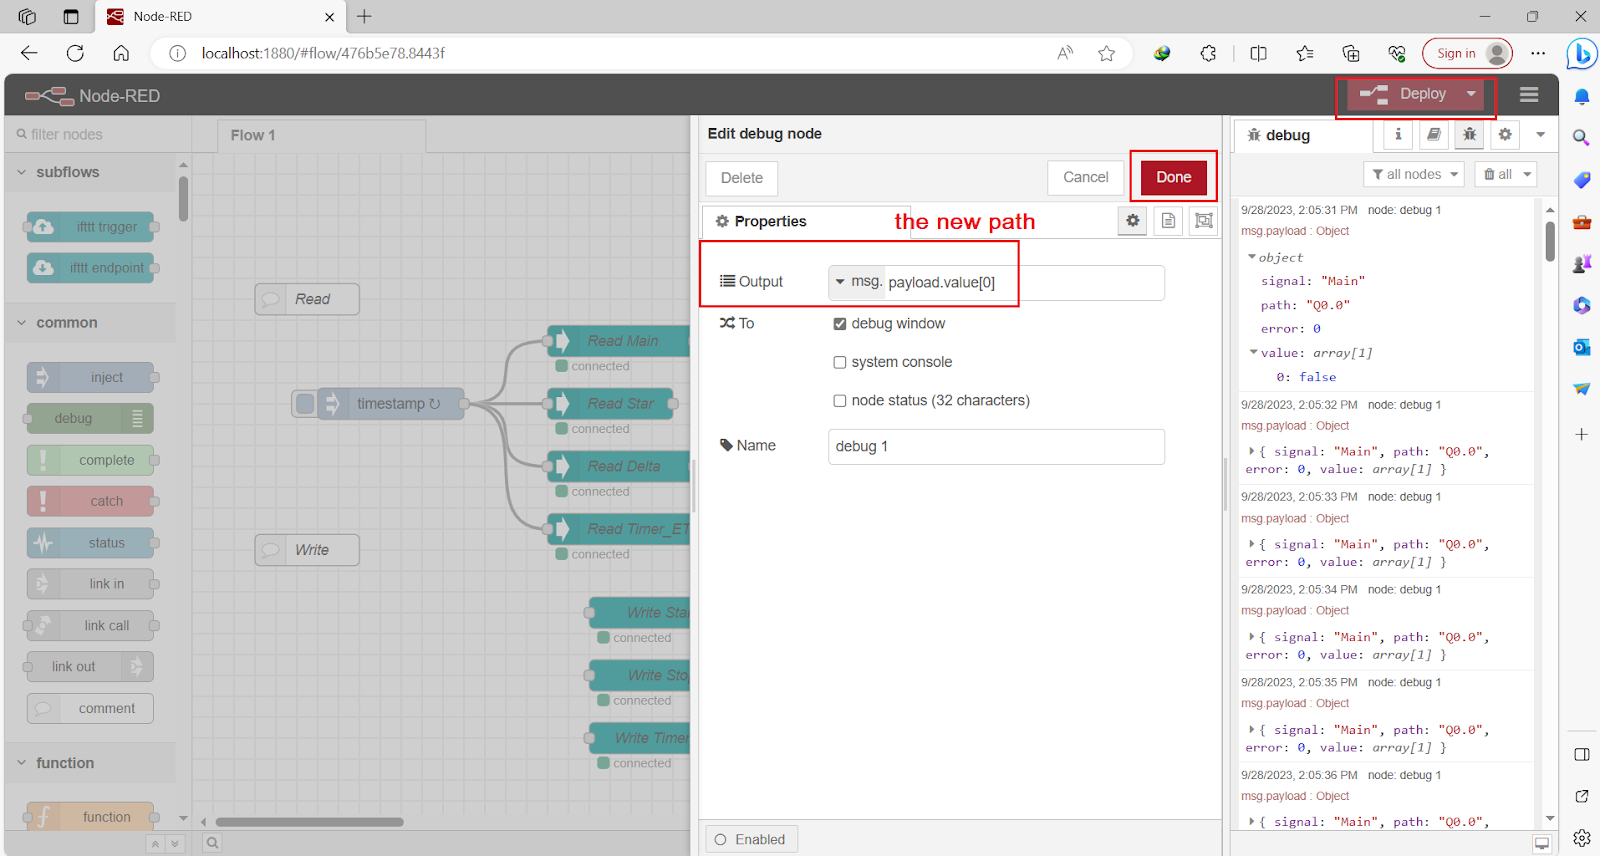
Double-click on the debug node, and in the 'output' section, add the path of the value you want to display in the debug window. You will find 'msg.payload'; delete 'payload' and paste the new path. Then, click 'Done' to save your changes. Activate your changes by clicking on 'Deploy'.
we read only the value of the state of the Main tag every 1 second
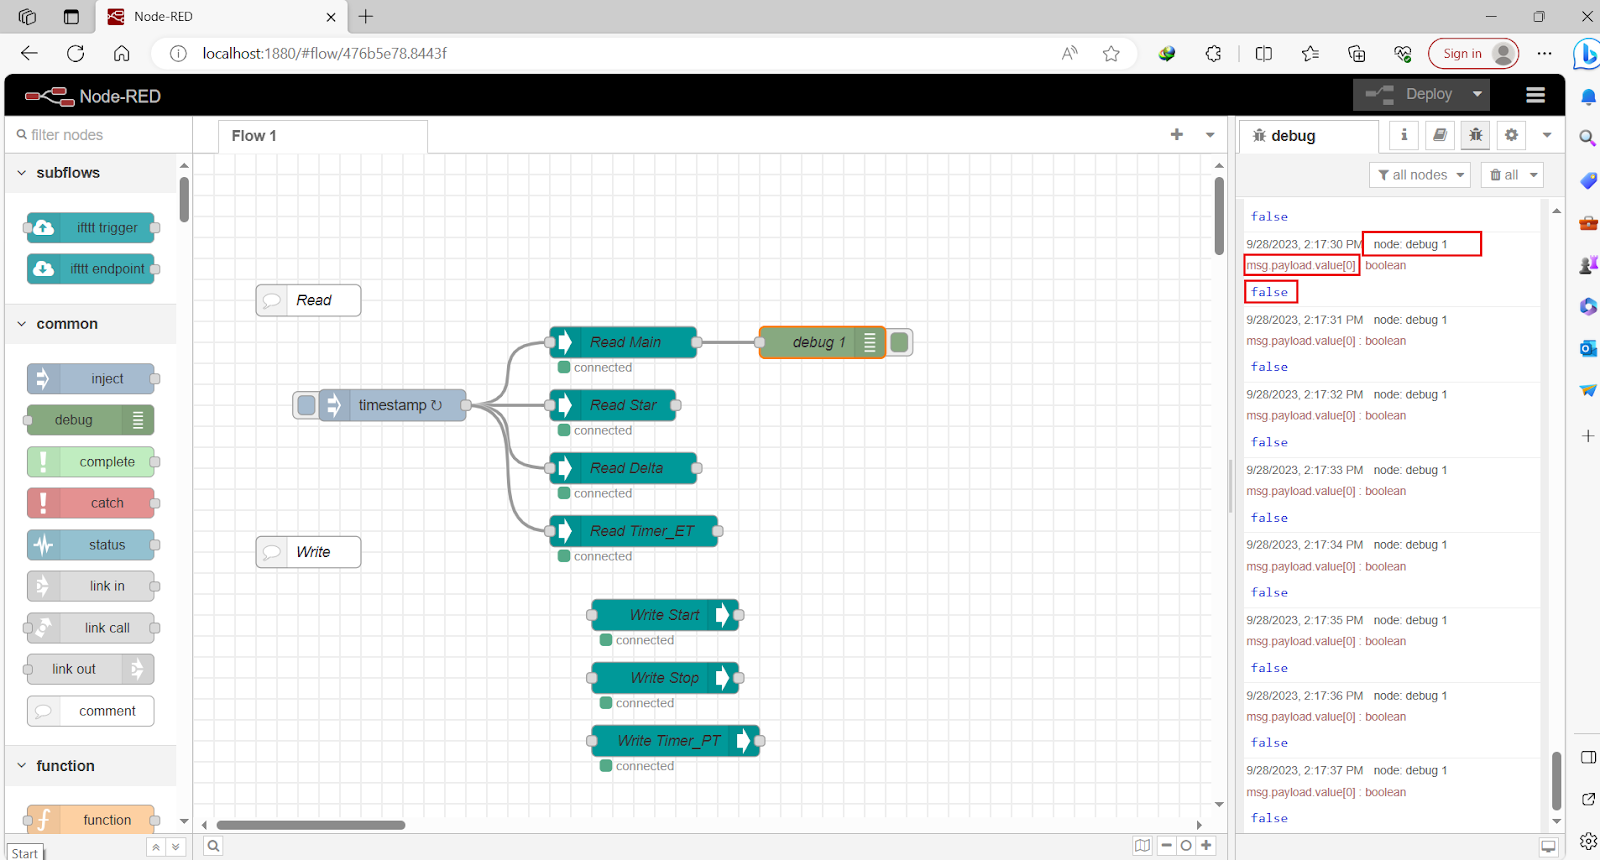
We can apply the same configuration to the other S7comm read nodes. Later on, we will use a dashboard to display our data, and we won't rely on the debug windows.
Node-RED side – S7Comm Write node Programming
Let's focus on writing data to the PLC. As we know, the inject node allows us to send data. In this case, we will utilize the inject node to send data to the S7comm Write node, enabling us to write data into the PLC. We'll employ 4 inject nodes: two to send 'true' and false for the 'Start' tag and two to send 'true' and 'false' for the 'Stop' tag (stop tag is True in our program).

Now, let's configure two inject nodes: the first one to send 'True' and the second one to send 'False'. Double click on the inject node and select in 'msg.payload' section Boolean data type with value 'true' and the second node is the same but with value 'false'.
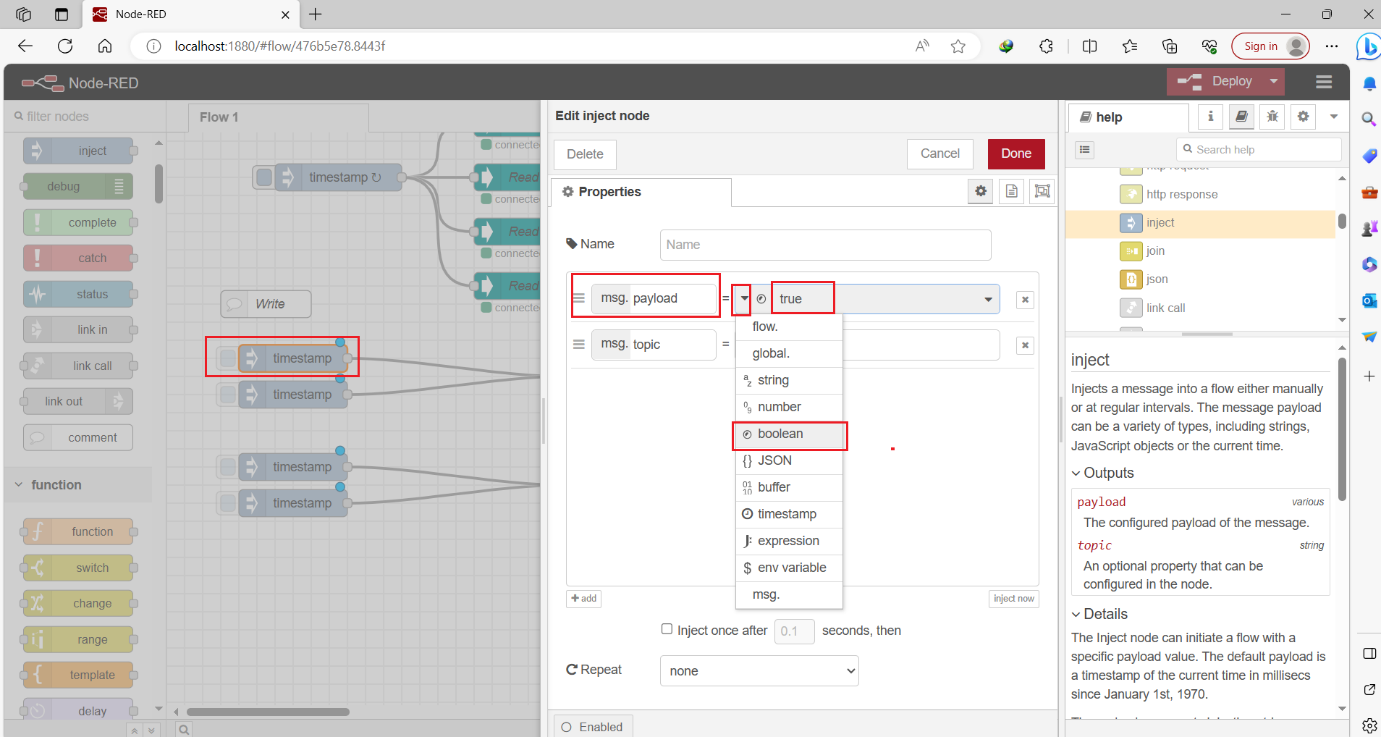
Click done and set second inject node to be 'false'
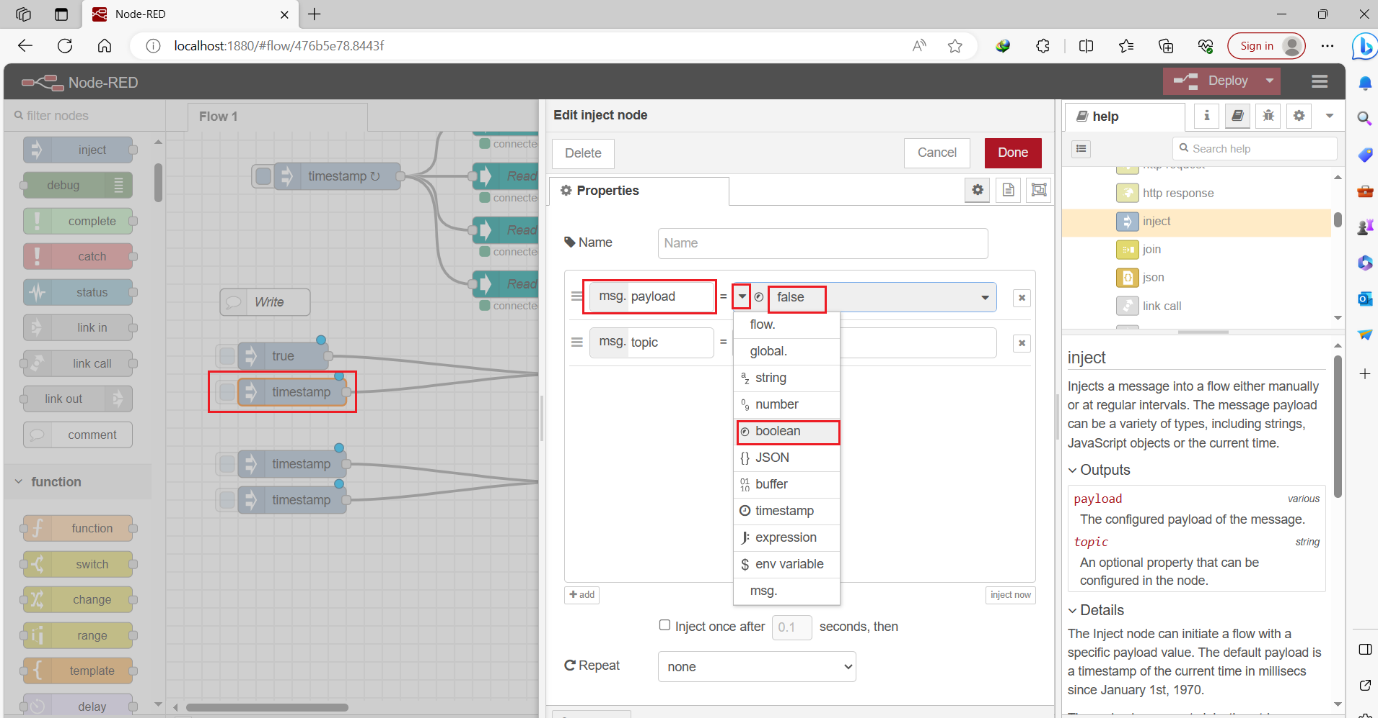
We will do the same with other two inject node
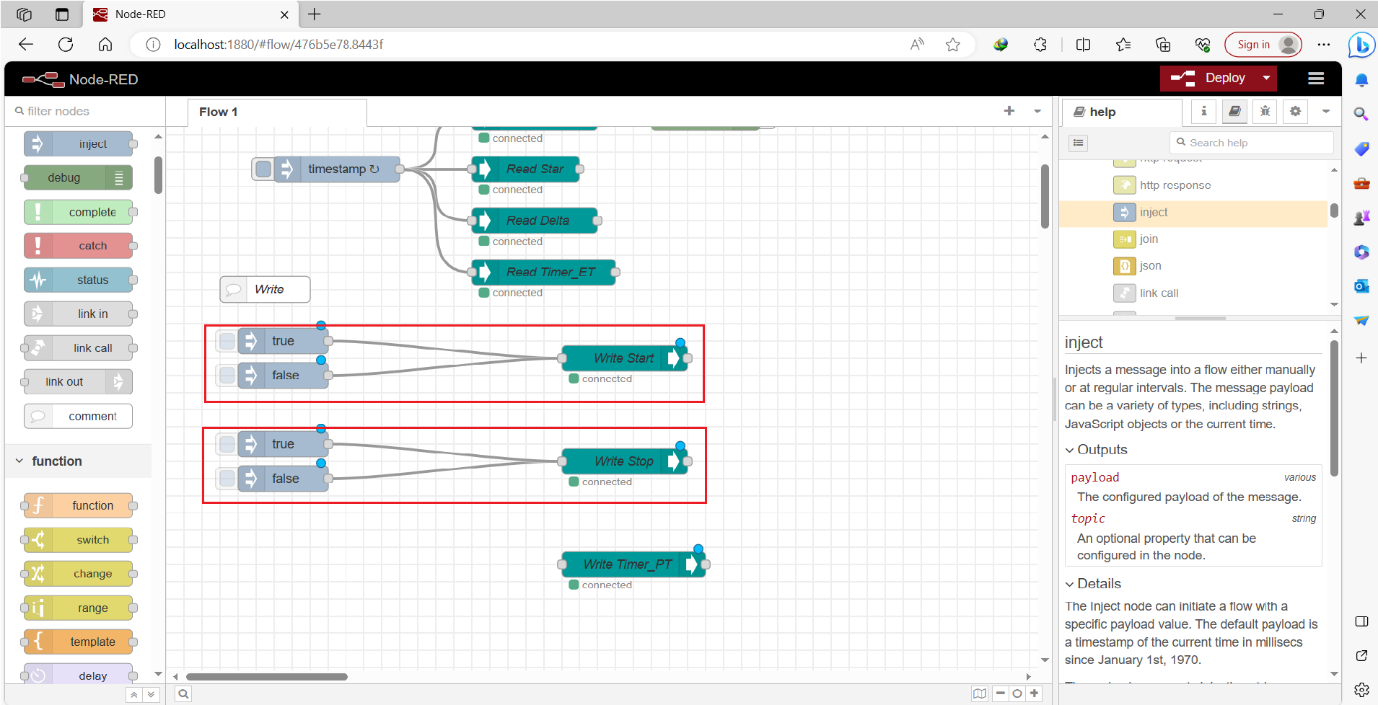
Now there is only one thing to make the writing data done correctly that is we need to send data as JSON object of type array not as Boolean as example {"value":[true]}

To send our data as a JSON object, we'll utilize two function nodes. One will be placed between the first two inject nodes and the 'Write Start S7Comm' node, and the other will be positioned between the other two inject nodes and the 'Write Stop S7Comm' node.
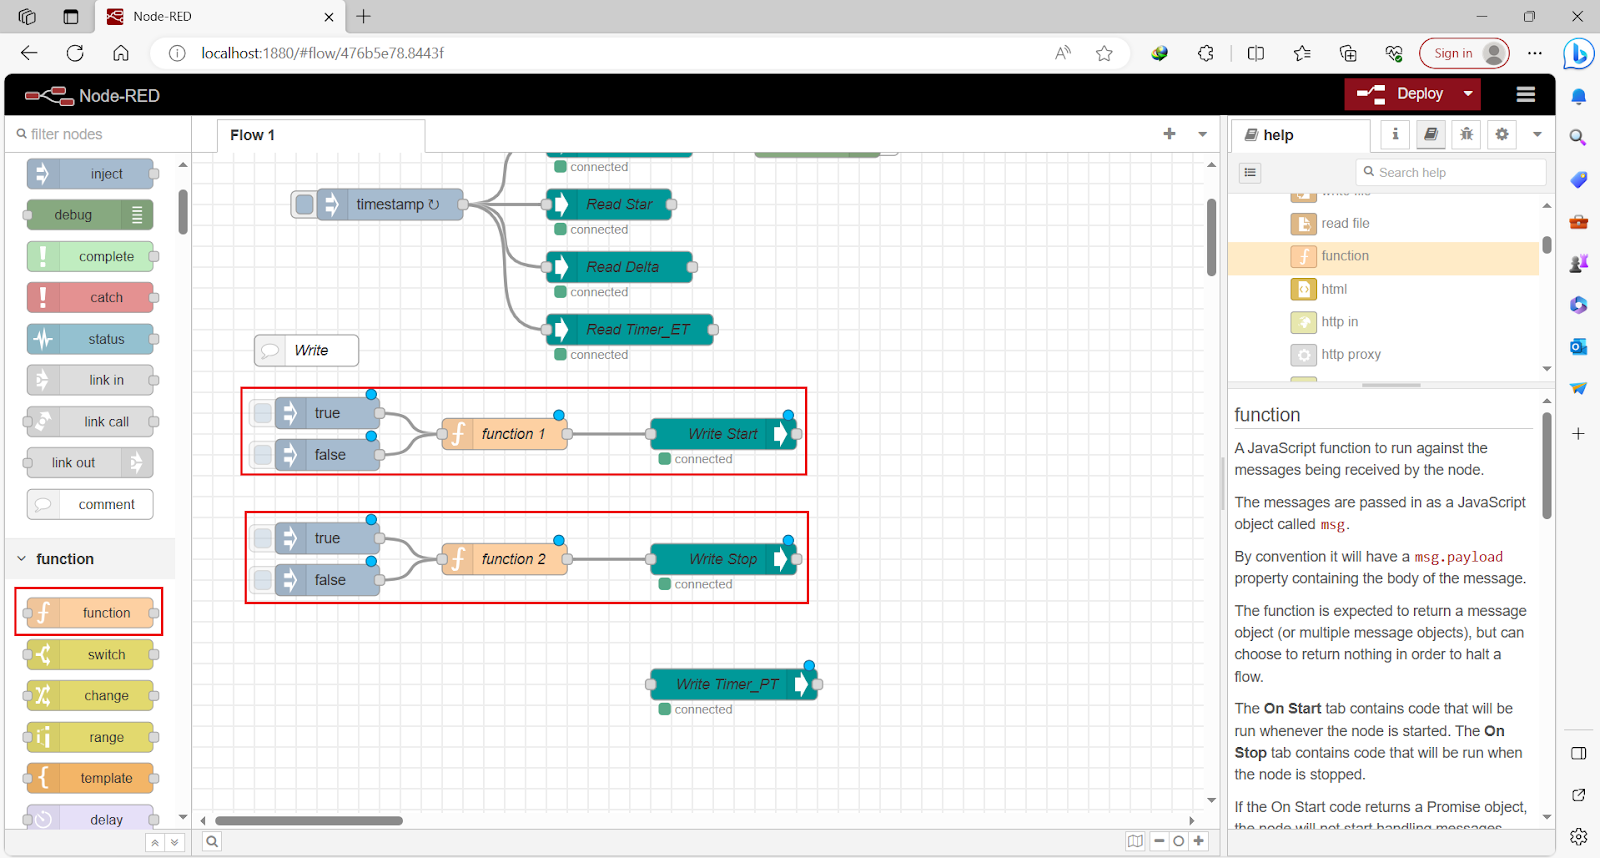
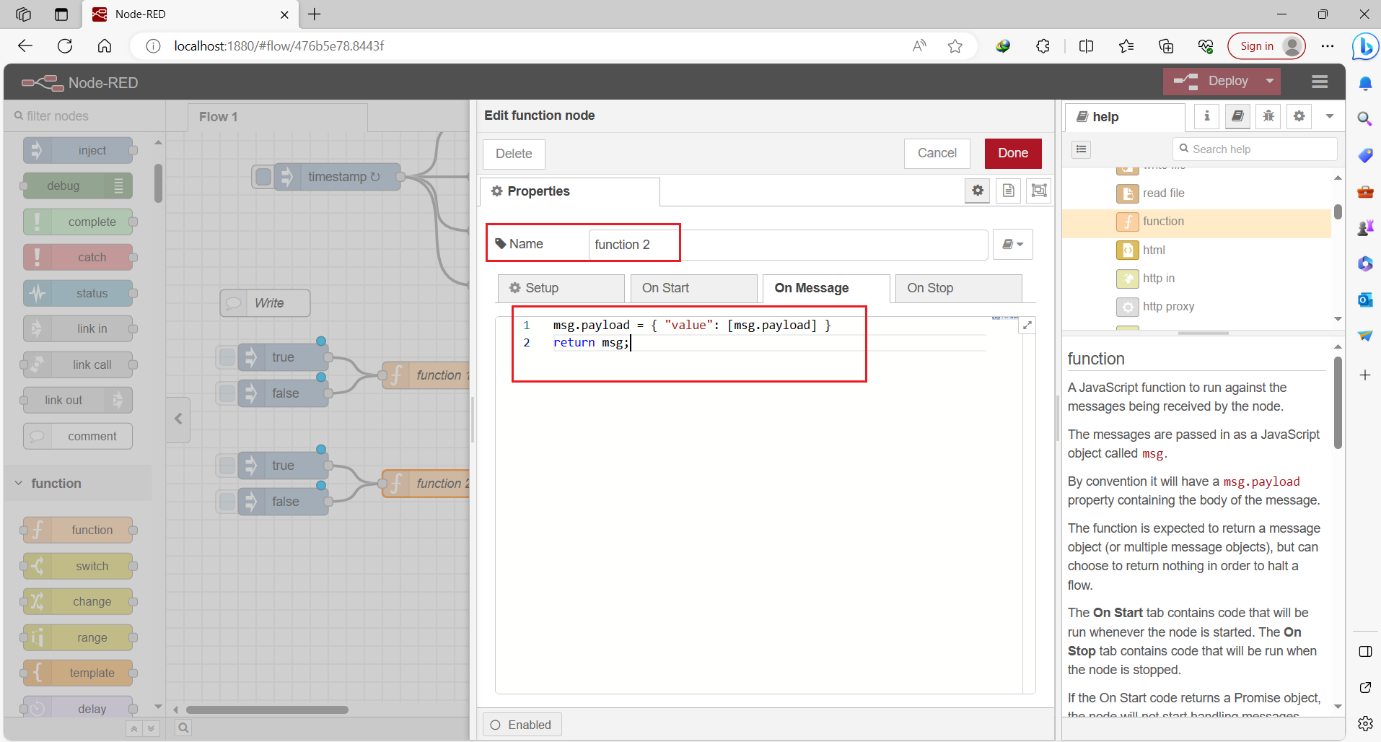
Double-click on the first Function node, and lets convert our message into JSON object
We have a 'msg.payload' with data of Boolean data type with Value 'true' so to convert it into JSON object we will make it by this ' msg.payload = {"value" :[msg.payload]} '

We will do the same to second Function and click on 'Done' and 'Deploy'
Now all is done and this is the way to send data and write into our PLC using S7comm write node later we will use dashboard to send data instead of inject node so let’s check sending data as we will see when we send 'true' to 'Start' tag the Main run and the S7comm read we did before read 'true' and when we send 'false' to 'Stop' tag the Main stop so S7comm read 'false'
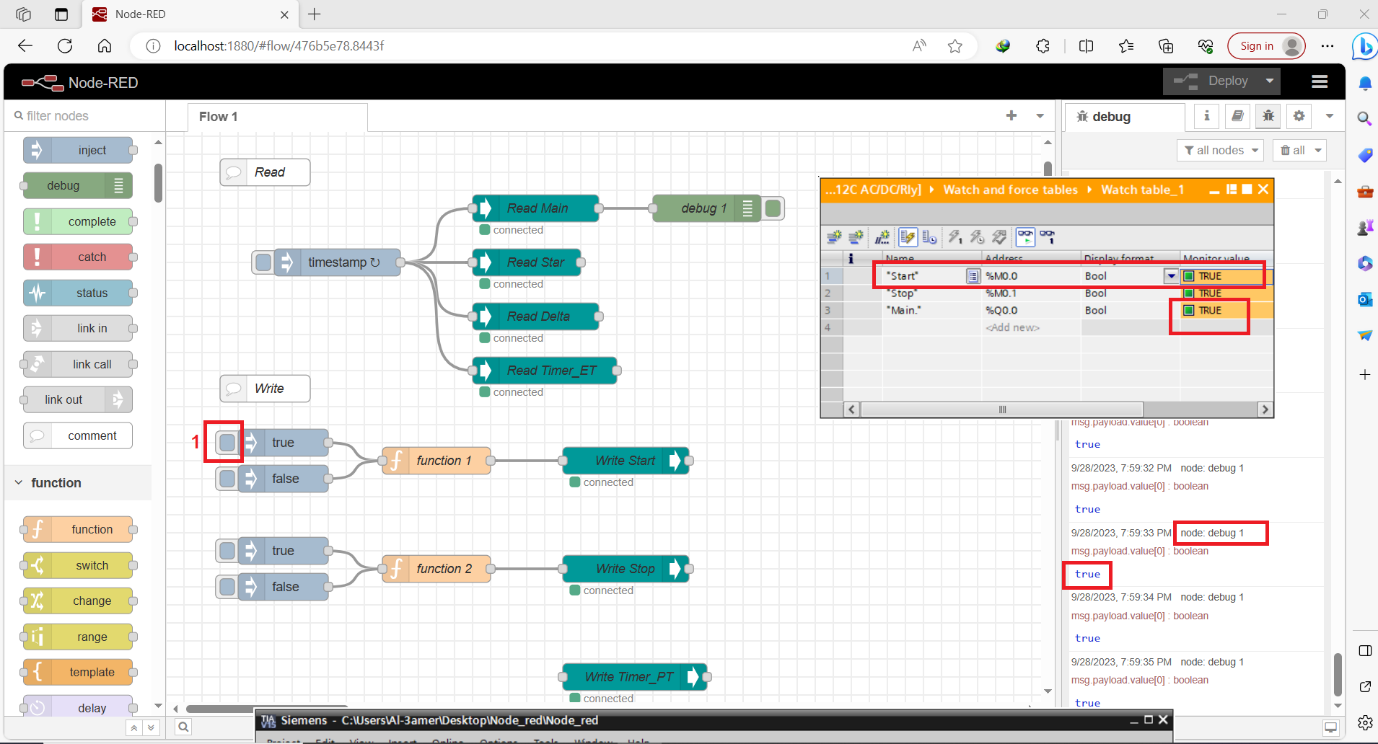
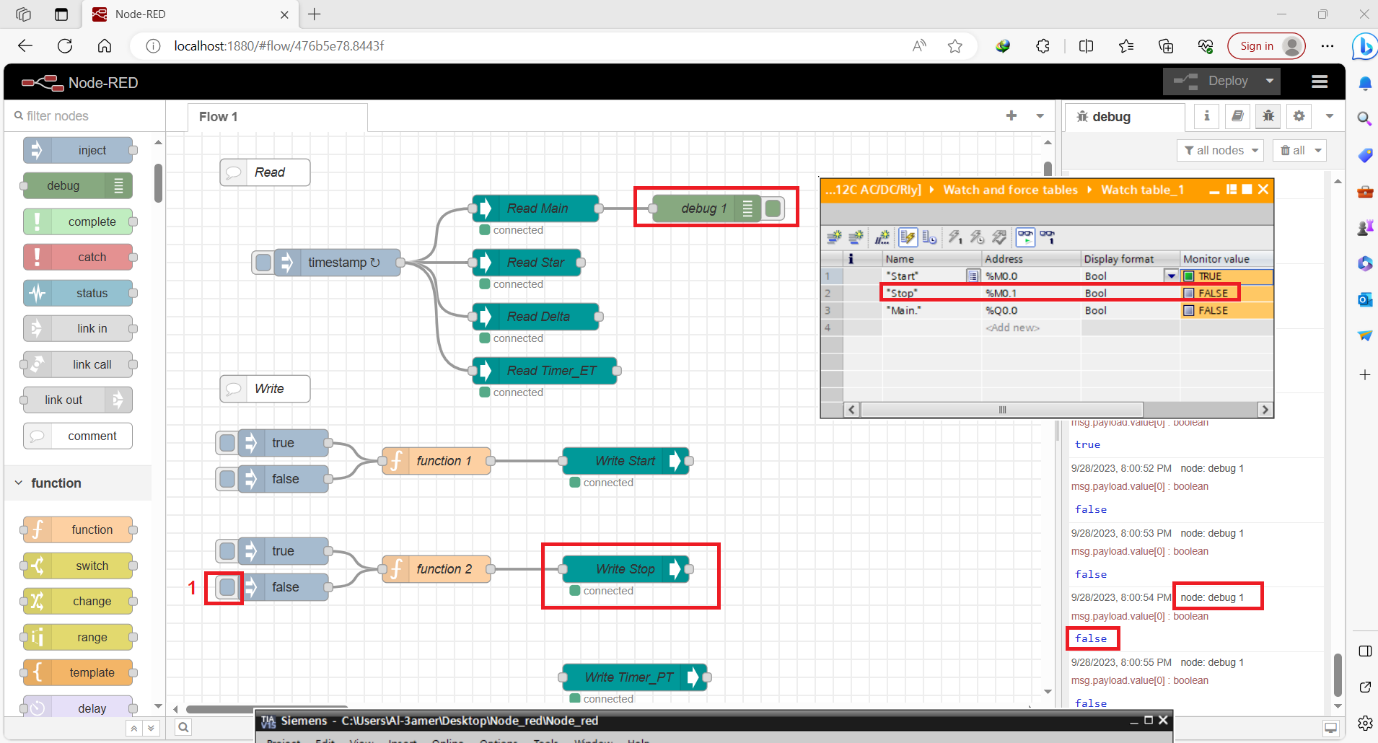
Now we can write data to our tags in PLC Using S7comm write node.
Node-RED side – Dashboard Configurations
Let’s discover dashboard palette nodes. Make sure you install the palette I mentioned before “node-red-dashboard” . You can find dashboard nodes in the list of nodes.
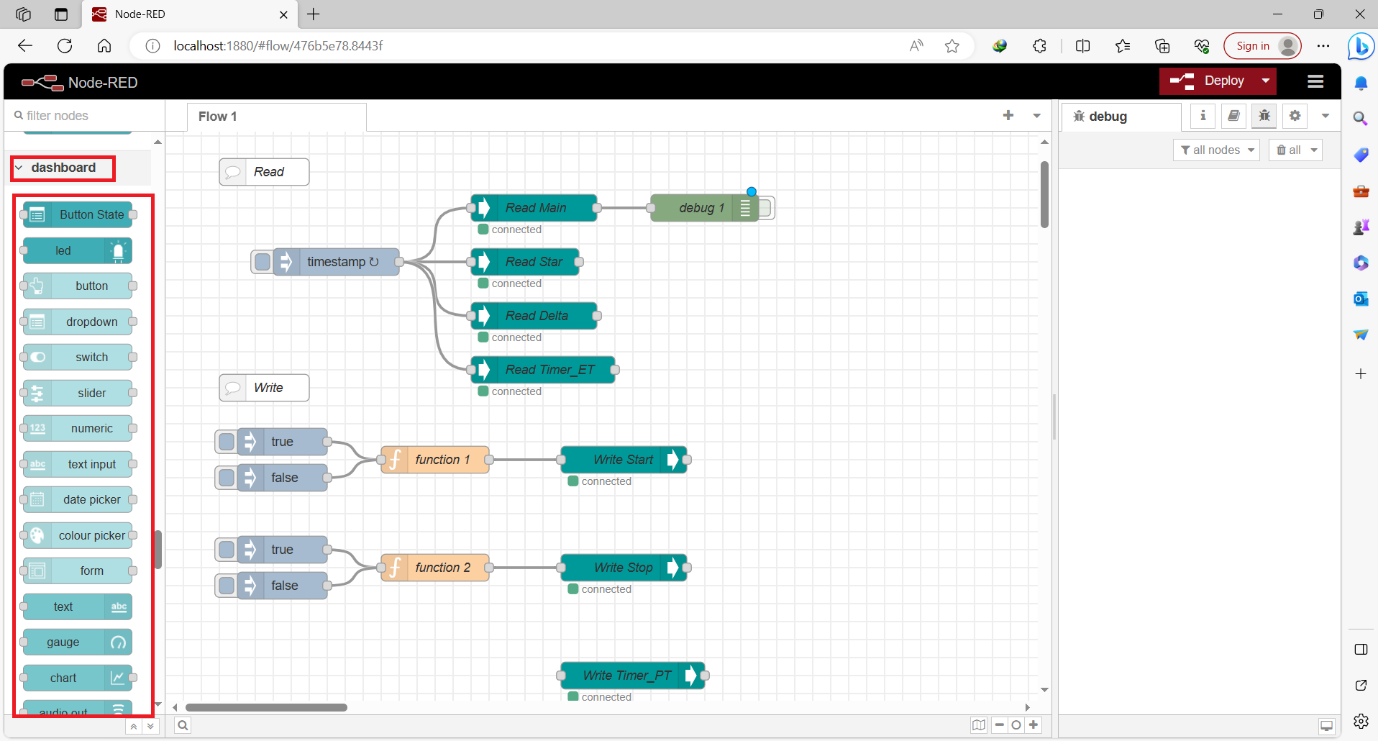
We have a lot of different nodes, let's take an example by adding a button node to our flow.
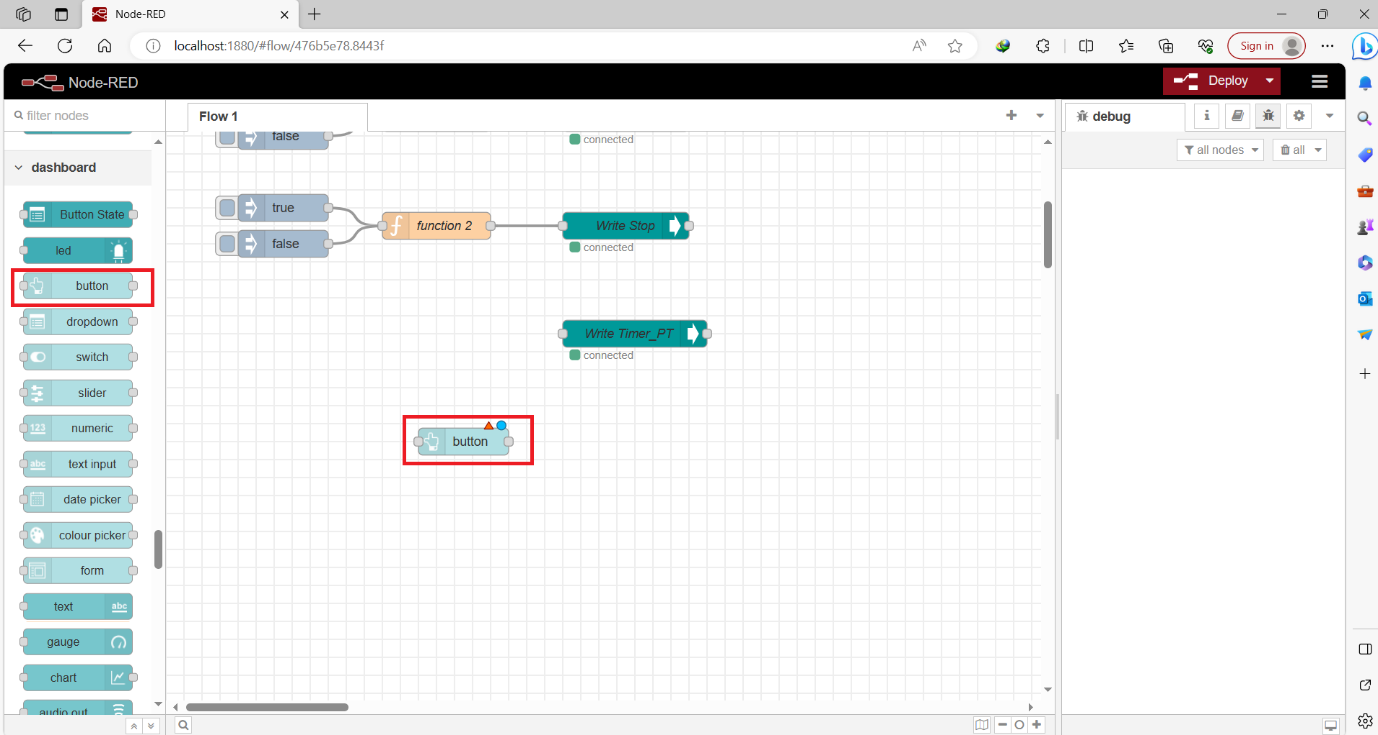
Double click on the button node to configure its settings. In the 'Group' section, you can define where the button will appear on the dashboard. You have the option to customize its size, icon, label, color, and background. What's essential here is specifying what data to send when the button is clicked. You can set this option in the 'Payload' section. As for the 'Topic', while it may not be critical in all cases, it can be useful for identifying the source of data. For example, if you have two buttons whose outputs go to the same function node and you want to distinguish between them, you can assign a unique topic to each button to differentiate their data sources.
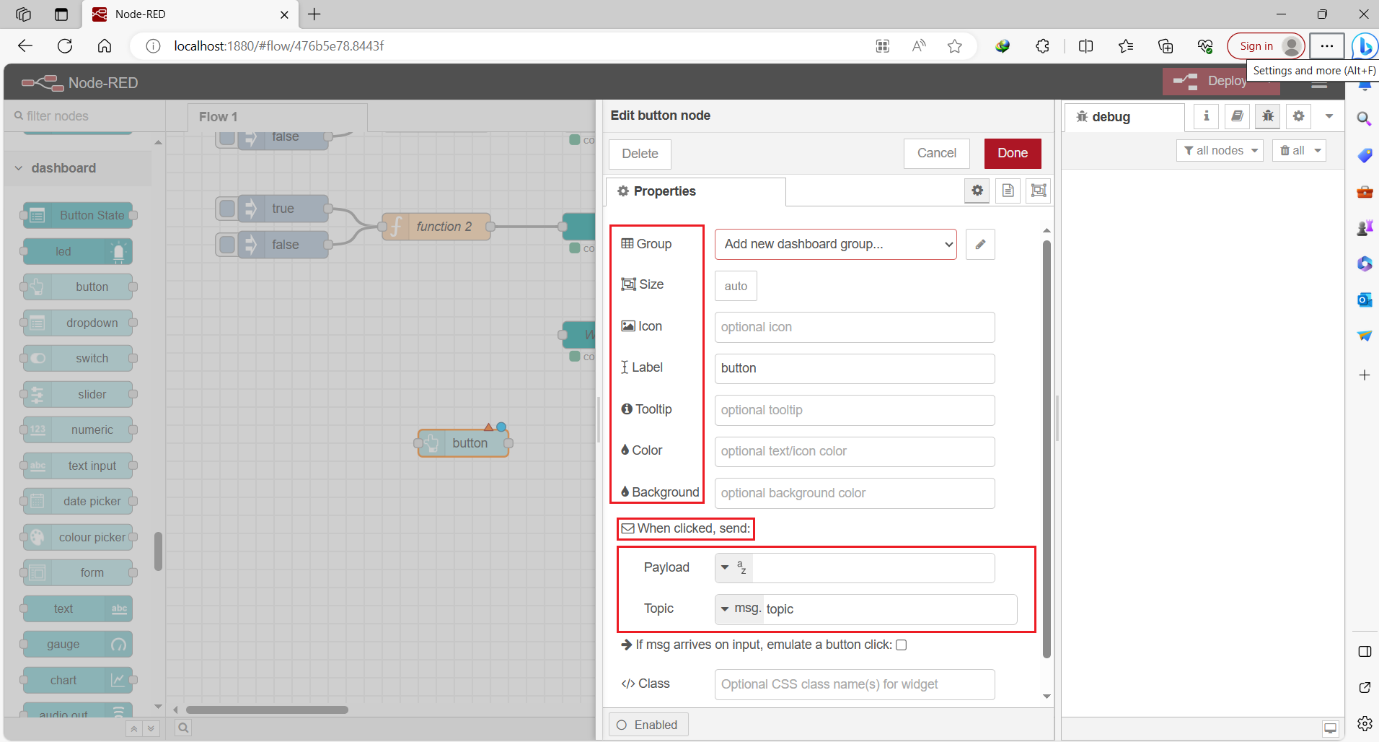
Now, let's focus on the important settings: Group section, label, and payload. We will create a new group in the 'Group' section
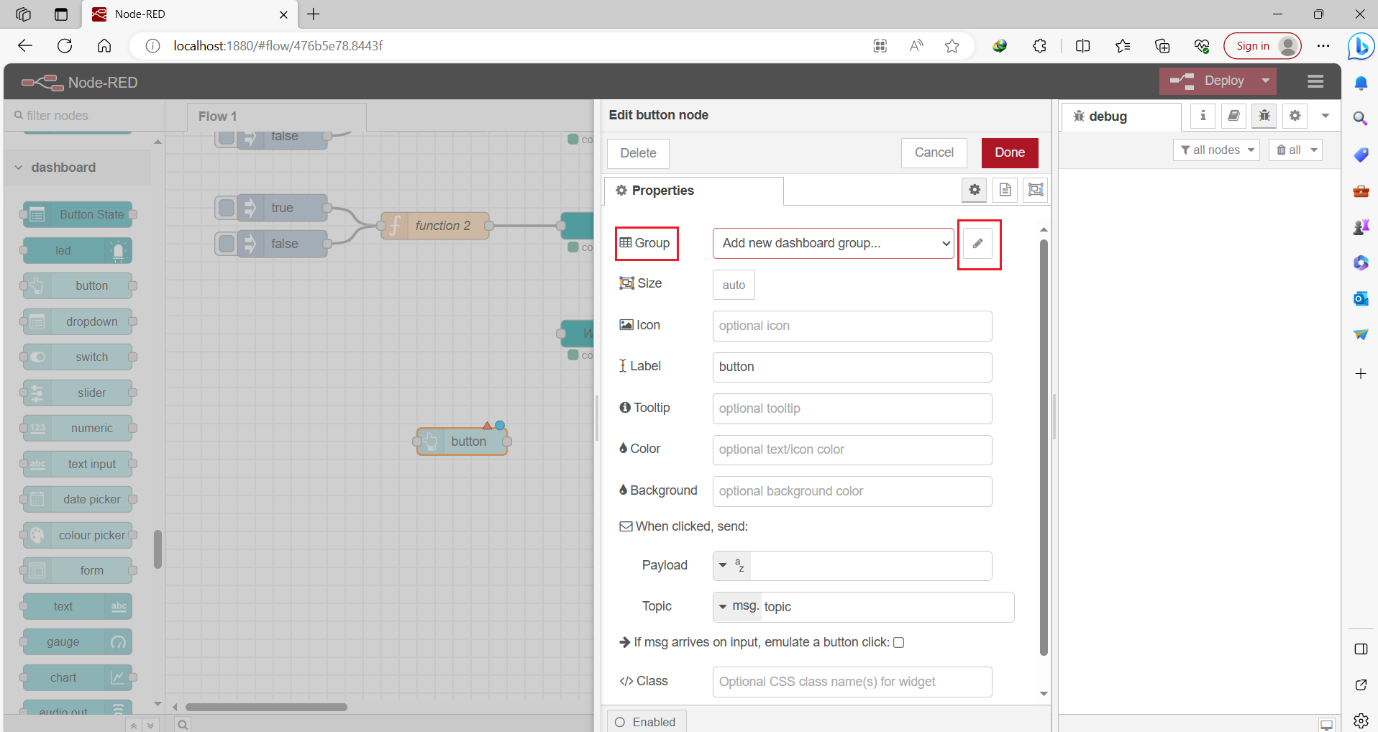
Now, give a name to the group. I will name it 'Inputs' which will also serve as the heading for this section on the dashboard page. Additionally, you should add a tab for the group, which will act as the main header for the dashboard page.
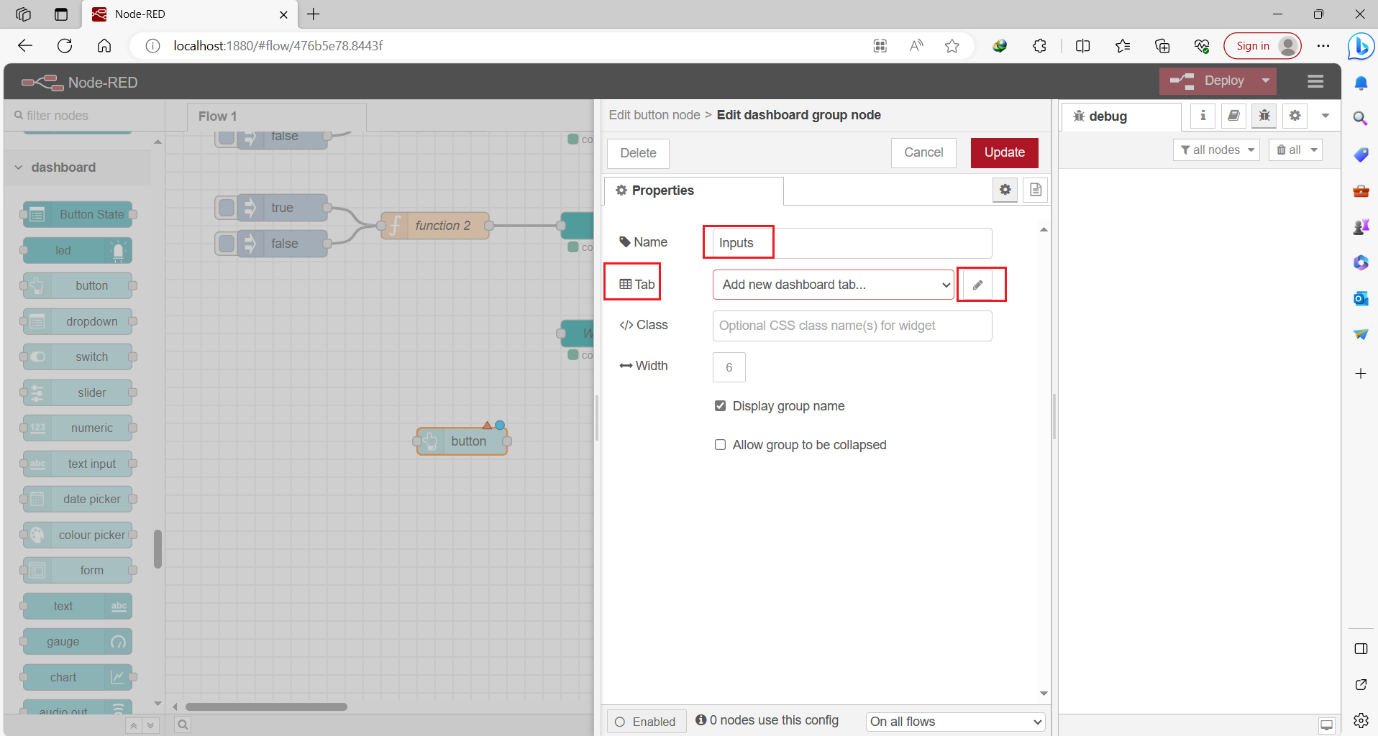
I've named the tab 'PLC.' Now, click on 'Add'.

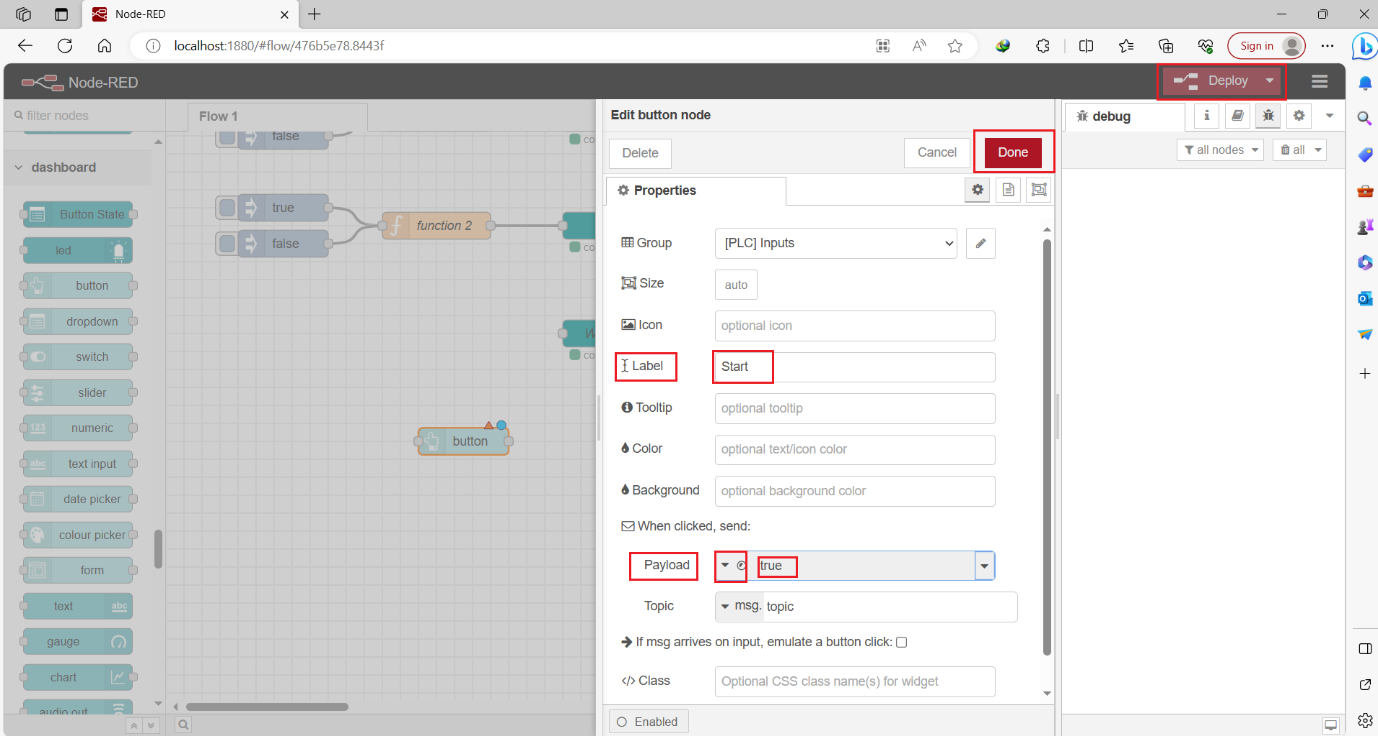
Return to the main settings and provide a suitable label for the button. Additionally, specify the data you want to send; in this case, I will send a boolean datatype with the value 'true.' Once you've done this, click on 'Done' and then 'Deploy' to activate the new changes
To view the dashboard, open either http://localhost:1880/ui or http://127.0.0.1:1880/ui in your web browser. You will see the tab name and the group containing the button.
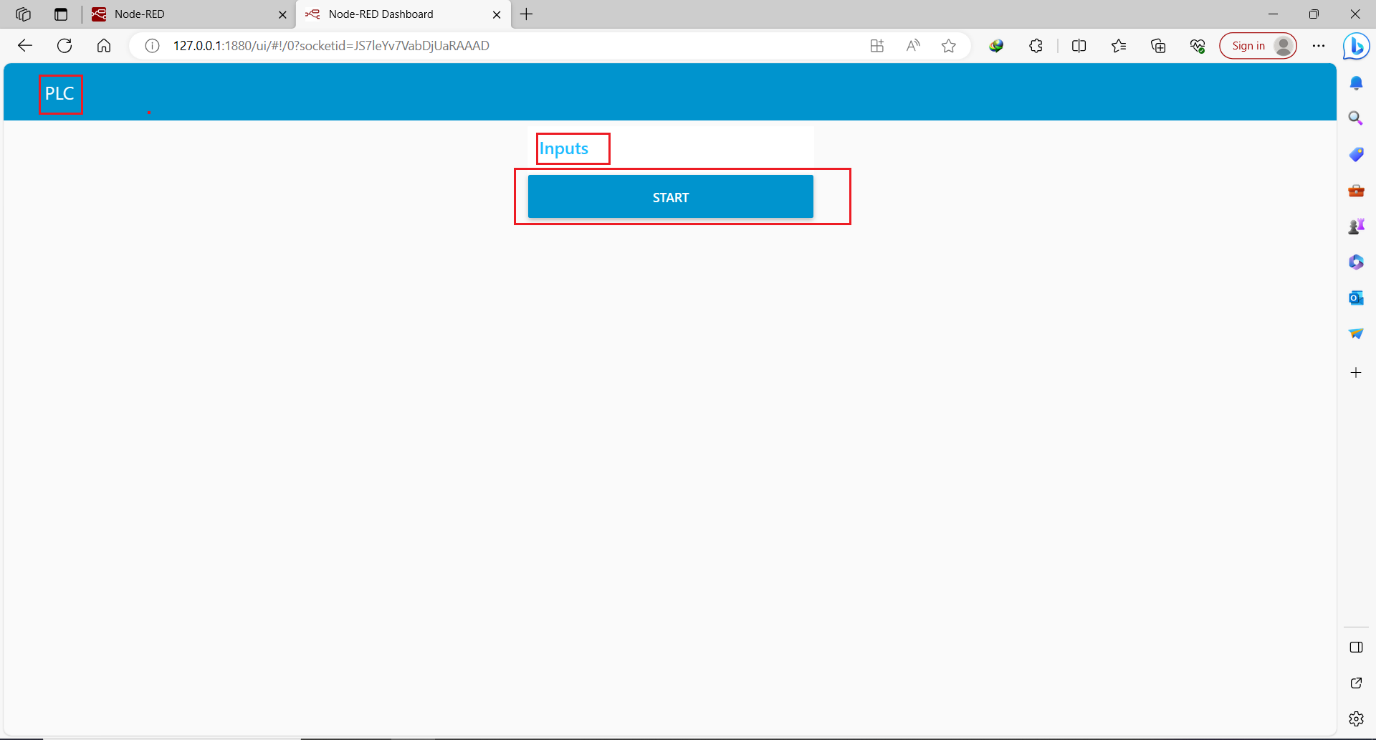
Now that we've completed configuring the dashboard nodes, you should have a good understanding of how to set up and display it. While other nodes may differ in functionality, the process remains the same. Let's move forward and create a comprehensive dashboard for our PLC program, further expanding our knowledge of dashboard management
Node-RED side – Dashboard for reading display
Now To display the states of Main, Star, and Delta, which have Boolean data types, we will use the LED node. Make sure you have the 'node-red-contrib-ui-led' installed. When the state is true, the LED will be green; when the state is false, it will turn red. For Timer ET, we will use a Text or Chart node for display.
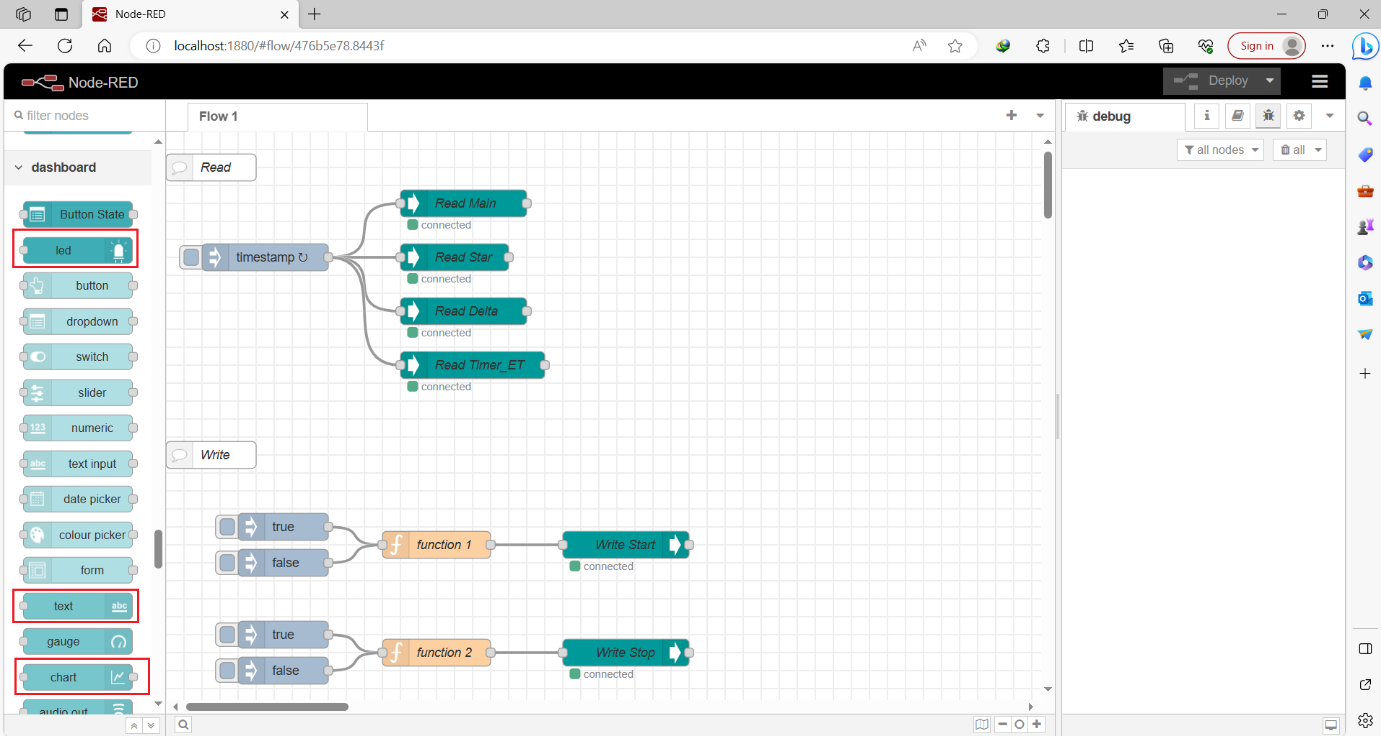
Drag three LED nodes for our three tags and connect each one to the output of the respective S7comm Read nodes. Similarly, do the same with the Text or Chart node for Timer ET.

Let's configure their settings. I will place the three LEDs in a group named 'Outputs' with the tab name 'PLC Dashboard.' Timer ET will be in a separate group named 'Timer' within the same tab.

To set up our LED nodes, we've defined the group name, tab, label, and color. By default, the LED node receives data at its input, and if the value is 'true,' the LED will be green; if it's 'false,' it will be red. We will do the same to the other two leds by changing only its label, one for 'Star' and other for 'Delta'. However, we encounter a challenge here. The data from the S7comm read node, as previously mentioned, provides an object with an array element containing the value we need. To extract only the value and disregard other information, we'll use a Function node placed between the LED node and the S7comm read node. This Function node will convert 'msg.payload' to 'msg.payload.value[0]' to obtain only the desired value

Now write your code in function as we mentioned above the three function will be the same code
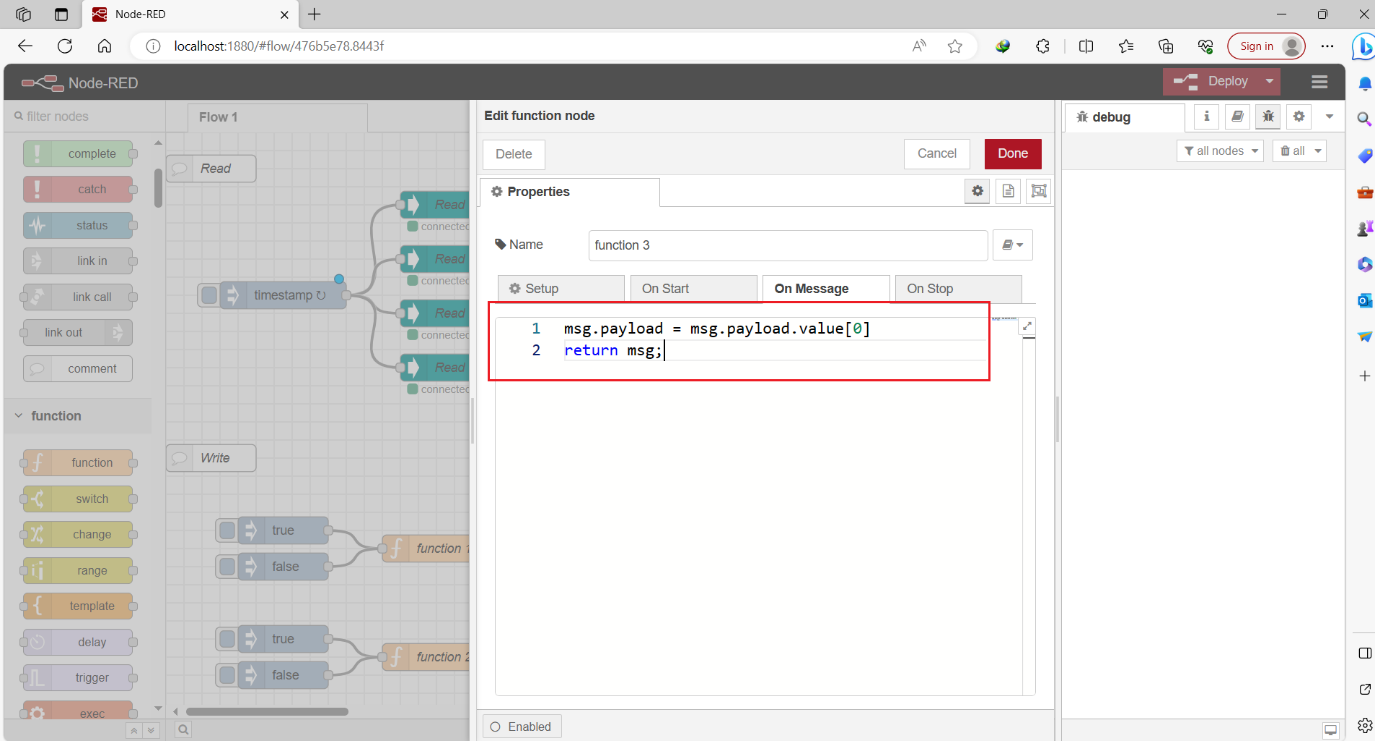
we've successfully configured the LED nodes, let's explore how to set up the Text node to display the Timer ET value. Double-click on the Text node to access its configurations. You'll find familiar sections, as mentioned earlier. We'll place it in a different group named 'Timer' and for the label, I'll use 'Timer' Unlike the LED nodes, we won't face the same issue of value reading here because there's a convenient 'Value Format' section. Here, you can specify exactly what you want to display from the data by enclosing your desired path within double curly braces, like this: {{msg.payload.value[0]}}. Additionally, you have the option to choose your preferred layout; I'll keep it as the default setting And click 'Done'.

Now, let's configure the Chart node. Double-click on it to access its configurations. In the 'Type' section, you can choose the type of chart you prefer. For this example, I'll select a line chart. Regarding the Y axes, I'll leave it on 'automatic' settings by leaving it empty. In the 'Series Color' section, the first color corresponds to the first chart. If the chart receives several values as inputs, it will display them all on the same chart using different colors. You can customize the colors as needed. You also have the option to activate the legend if you have multiple values in the same chart. Once you've made your selections, click 'Done' to save your settings.
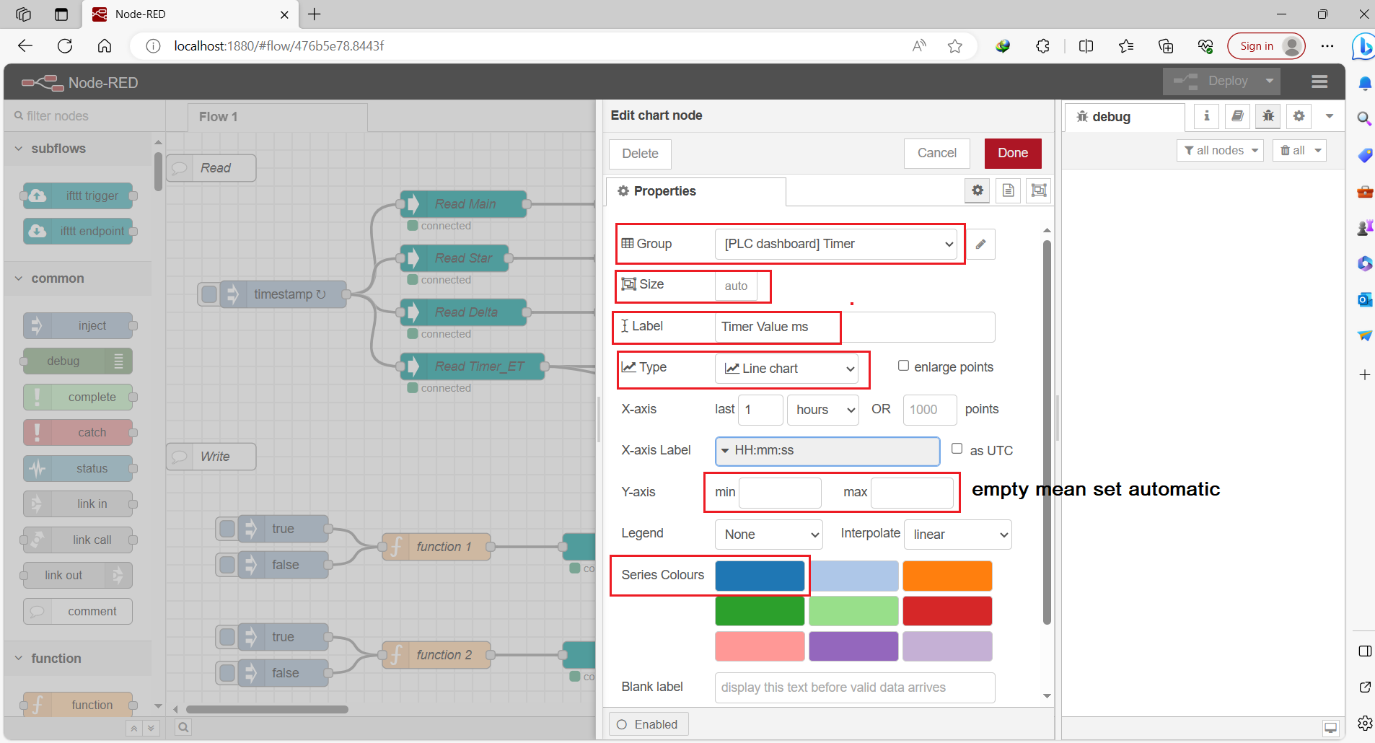
Since the Chart node doesn't have a 'Value Format' section like the Text node, we'll encounter a similar issue as with the LED node. To resolve this, we'll insert a Function node between the S7comm Read Timer ET node and the Chart node, utilizing the same code: 'msg.payload = msg.payload.value[0]' This ensures that only the relevant value is sent to the Chart node now do 'Deploy' to active all changes in our Flow.
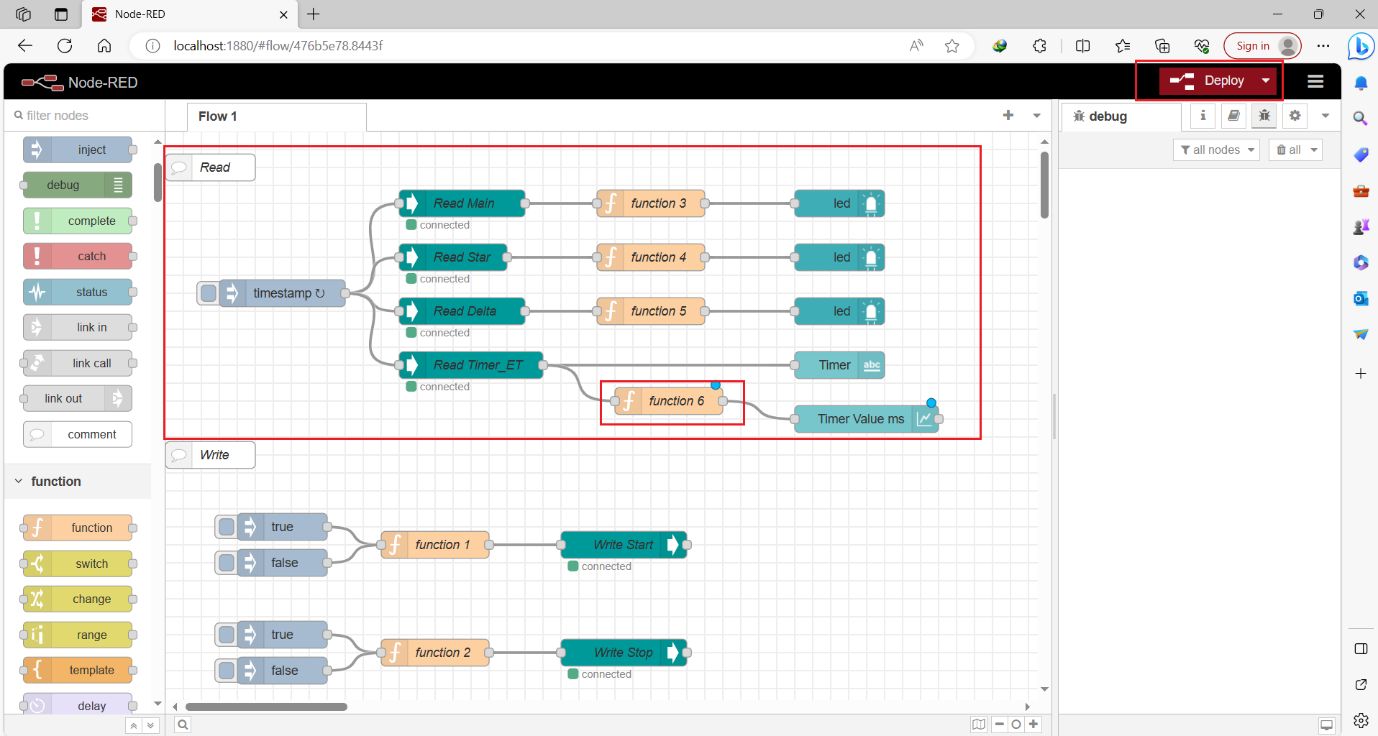
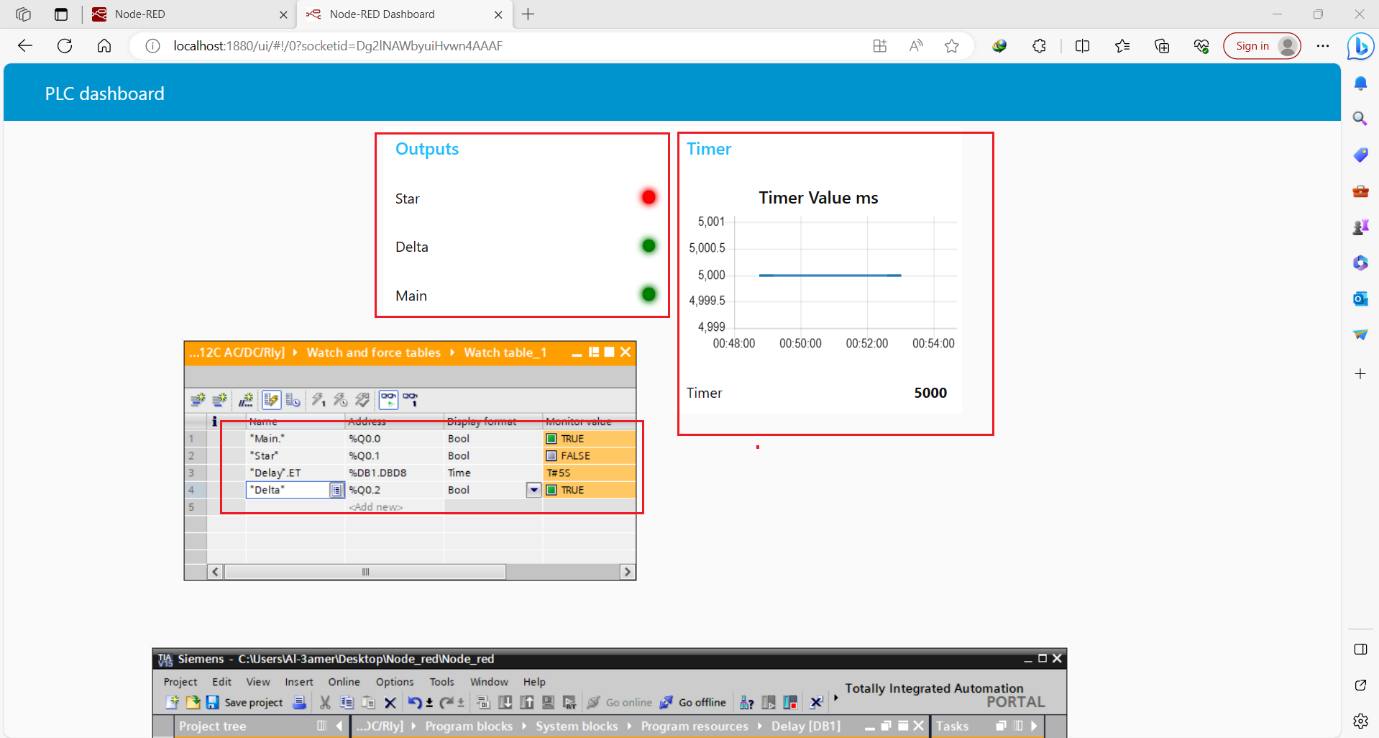
We're now finished! To display the Timer in seconds on the dashboard, you can adjust the code in the Function node connected to the Chart node to 'msg.payload = msg.payload.value[0] / 1000 ' and the same for Text node. However, you can leave it as it is, showing milliseconds, as per your preference
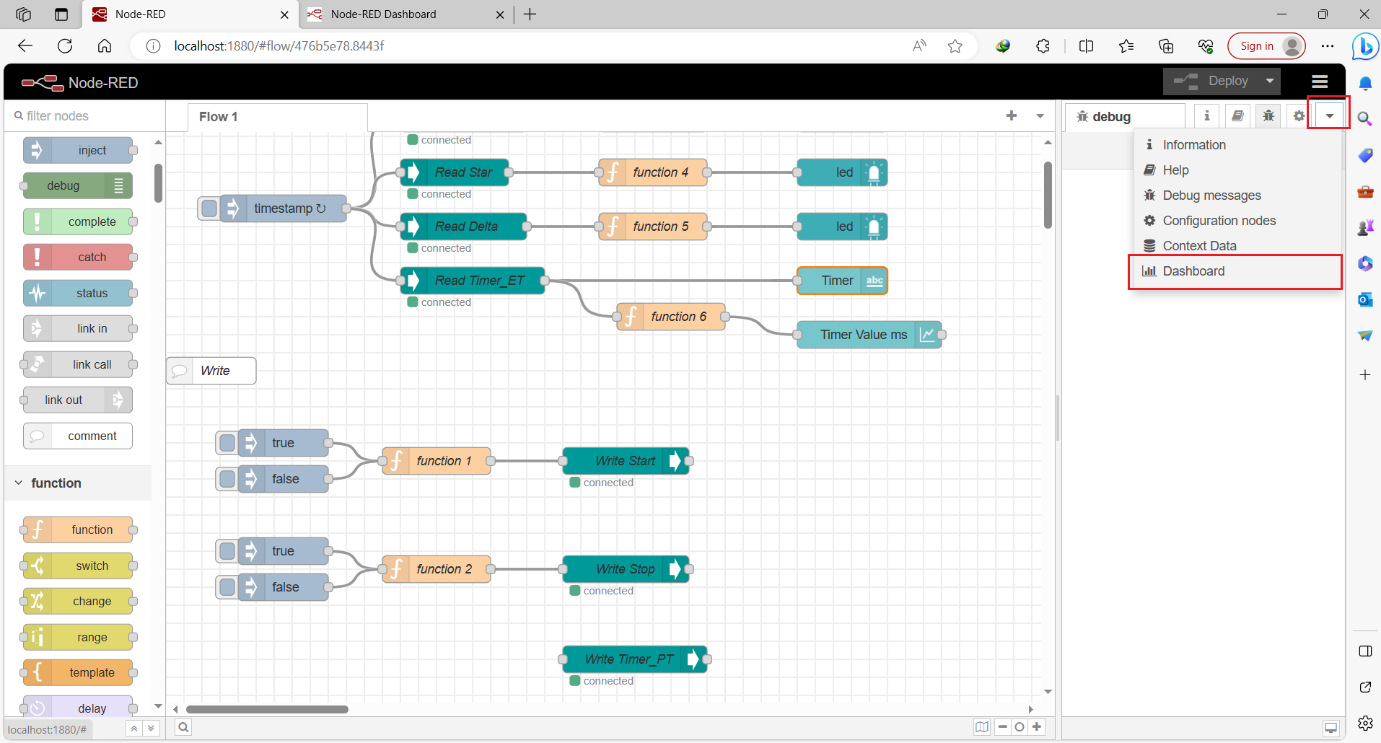
You can modify the layout of elements on the dashboard by accessing the dashboard settings in Node-RED.
We can also change the theme. For this tutorial, I'll keep everything in the default settings, but I'll rearrange the groups by placing the Timer group before the Outputs group. Additionally, I'll arrange Main led to be first. We can give each LED a name for easier position modification.
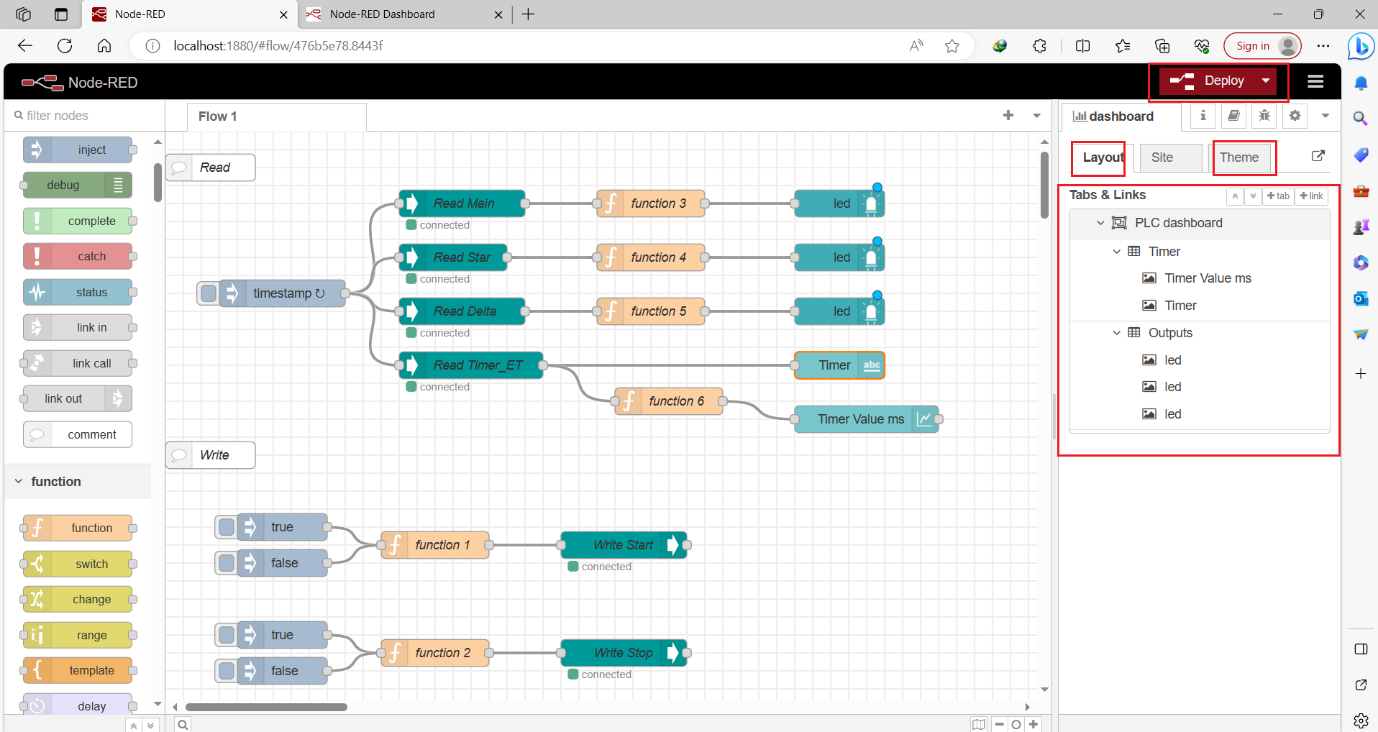
Now, click 'Deploy,' and then go to the dashboard to view the changes.
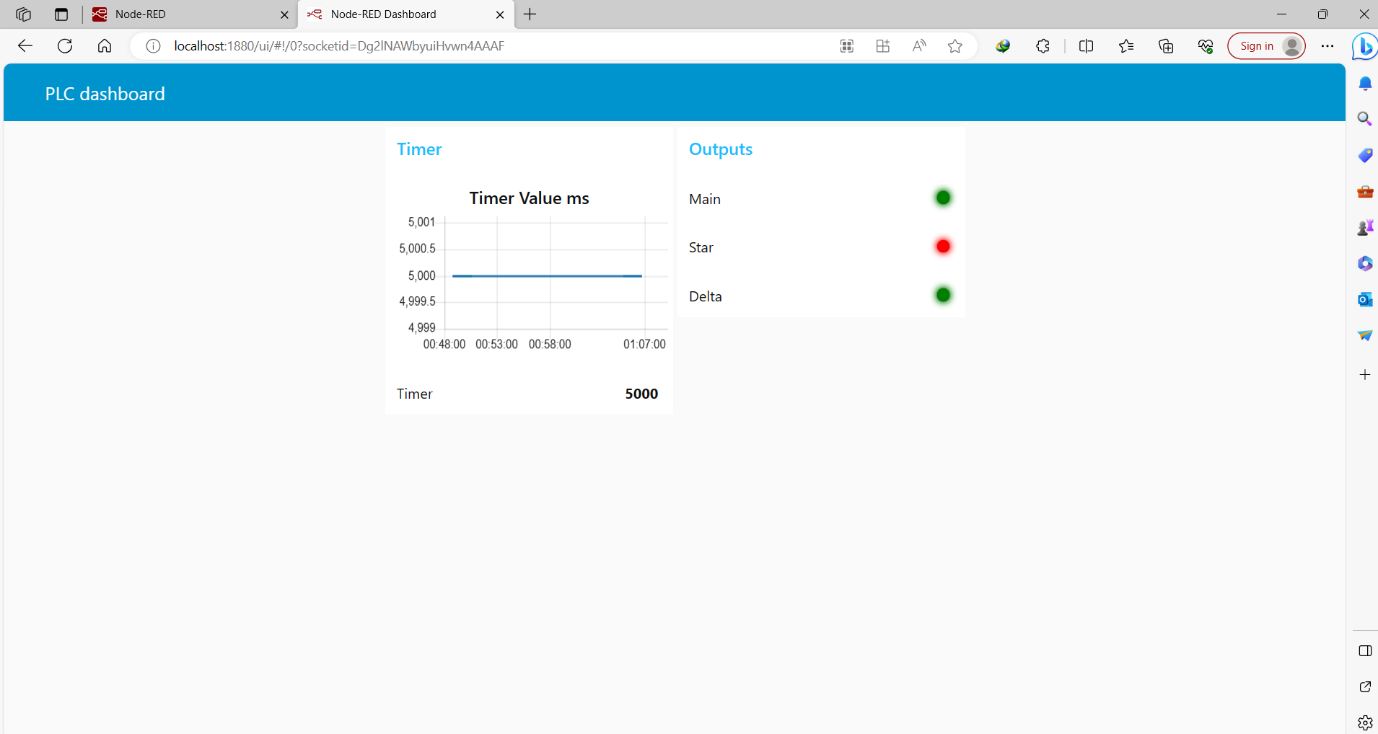
Finally, let's configure the dashboard elements for writing data into the PLC.
Node-RED side – Dashboard for writing display
We have three tags: two of them are of Boolean data type, Start and Stop tags, and the third is a Dword data type, Timer PT tag. To control the first tag, which is 'Start,' we'll add both a button node and a switch node. We will use the button node for Start tag and switch node for Stop tag. These two nodes will send data to our S7comm write node. To streamline the setup, we'll remove the four inject nodes we created earlier and instead, connect the outputs of the button node or switch node to a function node. This function node will convert the data into a JSON object, and its output will be connected to the input of the S7comm write node.
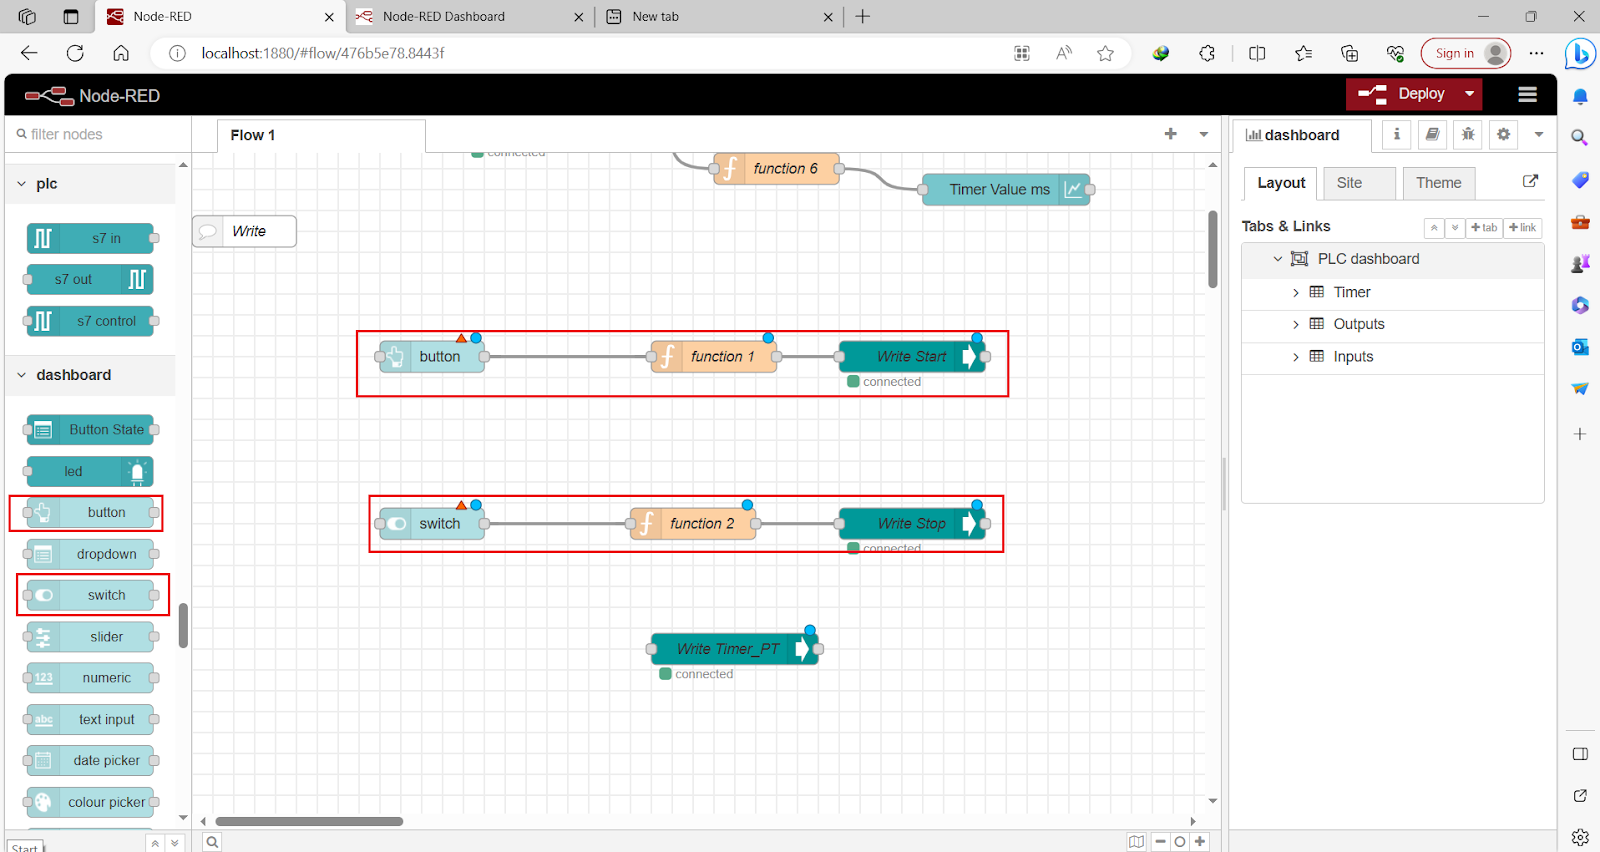
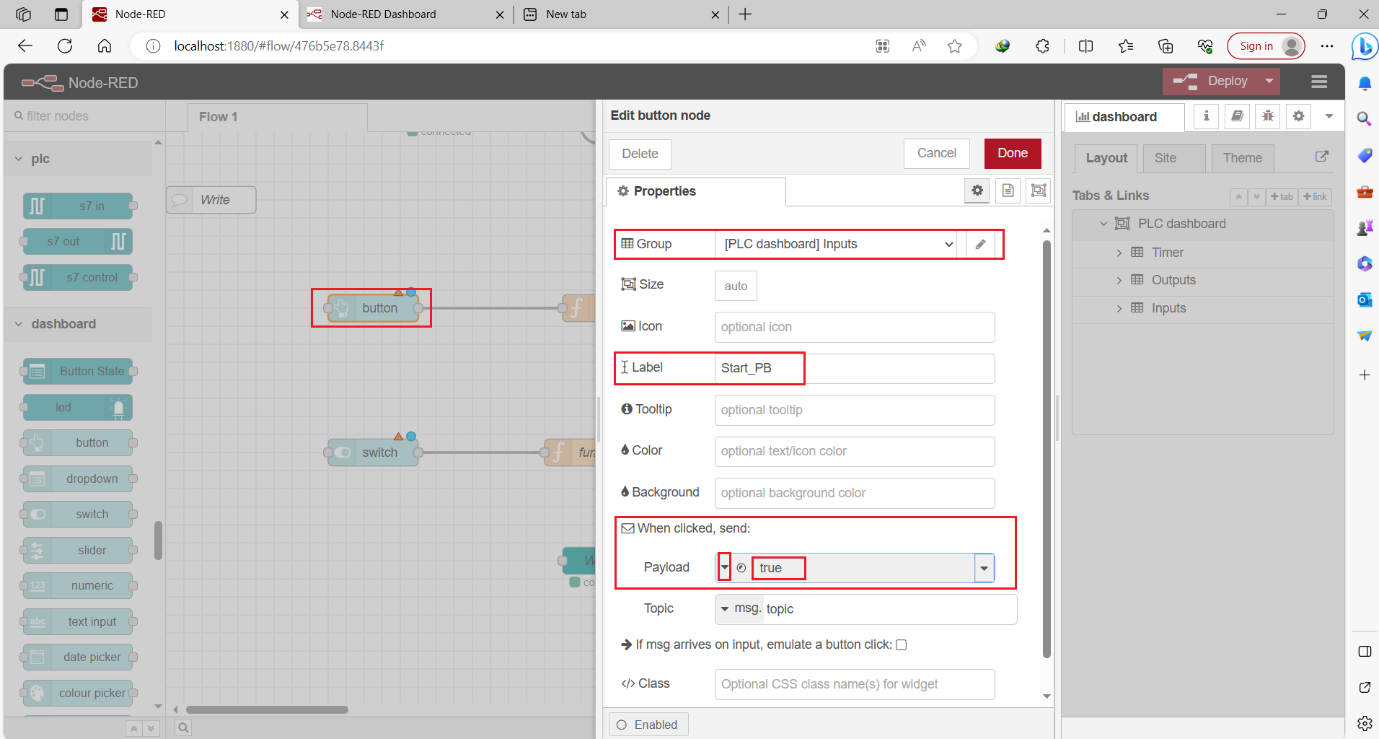
Double-click on the button node and set its group to 'Inputs' with the same tab as the other dashboard nodes we previously created. I will label it as 'Start_PB.' In the Payload section, I'll select a 'Boolean' data type with a value of 'true,' which we have already configured together. Once done, click 'Done' to save the settings
The current behavior of the button node sends 'true' only when clicked. However, a typical push button sends a 'true' signal while it's being pressed and returns 'false' when released. To make the button node act like a push button, triggering a 'true' signal when clicked and 'false' when released, we need to use a 'trigger' node. Grab the trigger node from the list of nodes and connect it between the button node and the function node.
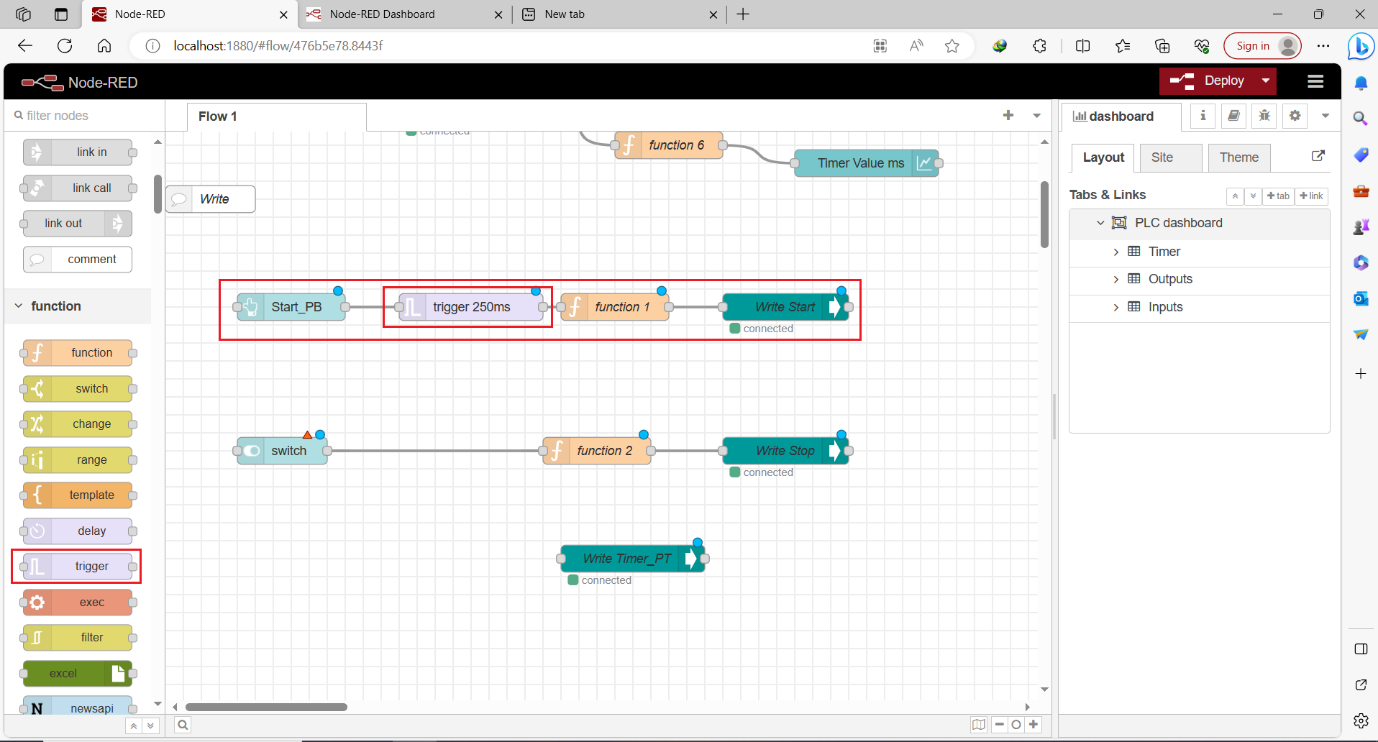
Double-click on the trigger node to configure its settings. When the input of the trigger node is activated, it will send the message selected in the 'Send' section, followed by a delay and then the message chosen in the 'Then Send' section. In our case, we will send a Boolean datatype with 'True' and wait for the default 250ms, followed by 'False.' Now, the button node will be used solely to activate the input of the trigger node, and the message selected in the button node becomes less important.

Double-click on the switch node to configure its settings. Place it in the same group as the button node and label it 'Stop_SW.' In the 'Send' section, the switch is set to send 'true' when it's on and 'false' when it's off, which is the behavior we want. Keep these settings as they are and click 'Done' to save your configuration
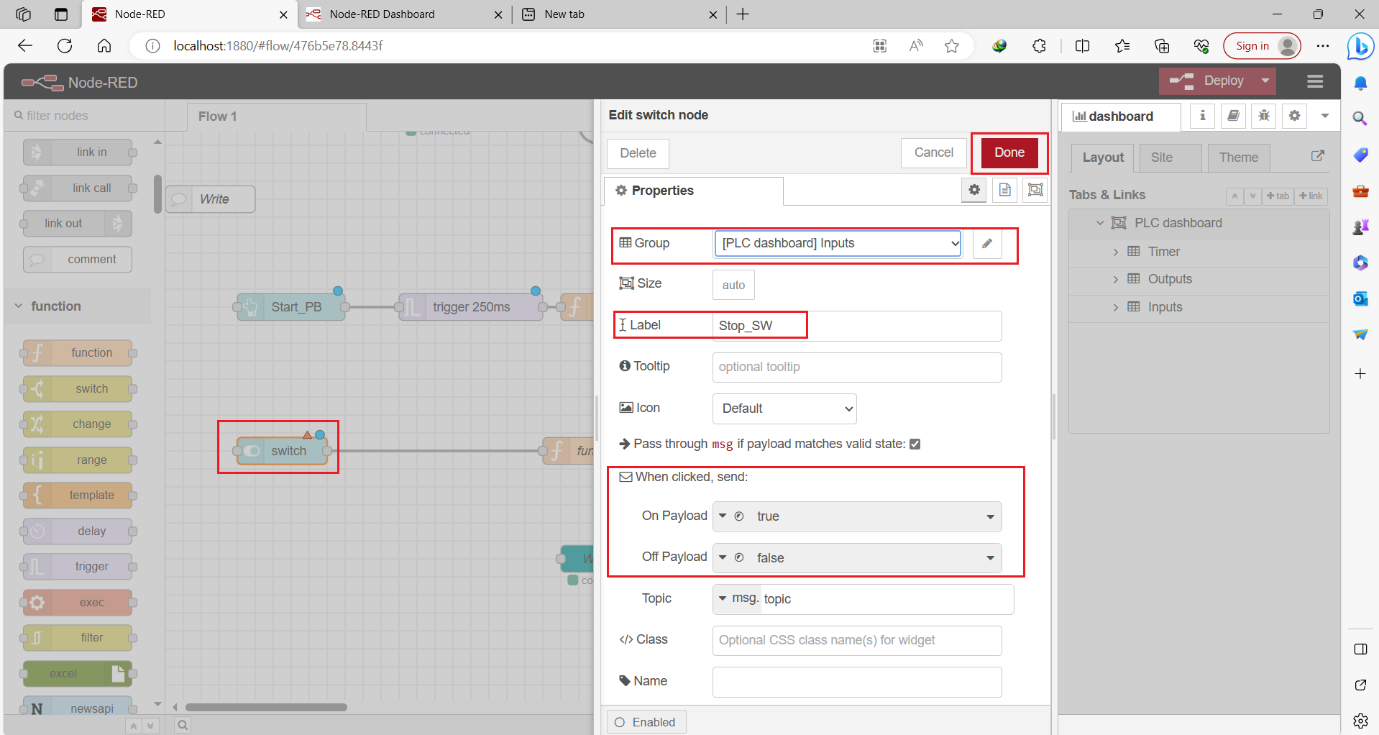
We created a Pushbutton for the Start tag and a Switch for the Stop tag. Additionally, we can create a Pushbutton for the Stop tag but we used two of them to explore more dashboard nodes and their usage. To send data to the Timer PT S7comm write node, we'll send a number representing the preset value of the timer in milliseconds. We have various options for input nodes, including Text Input, Slider, Numeric, and Dropdown nodes. In this tutorial, we'll use all of them to learn how to work with dashboard nodes effectively. We'll connect all these input nodes to a Function node, which will convert our messages into JSON objects. The output of the Function node will be connected to the input of the S7comm write node.
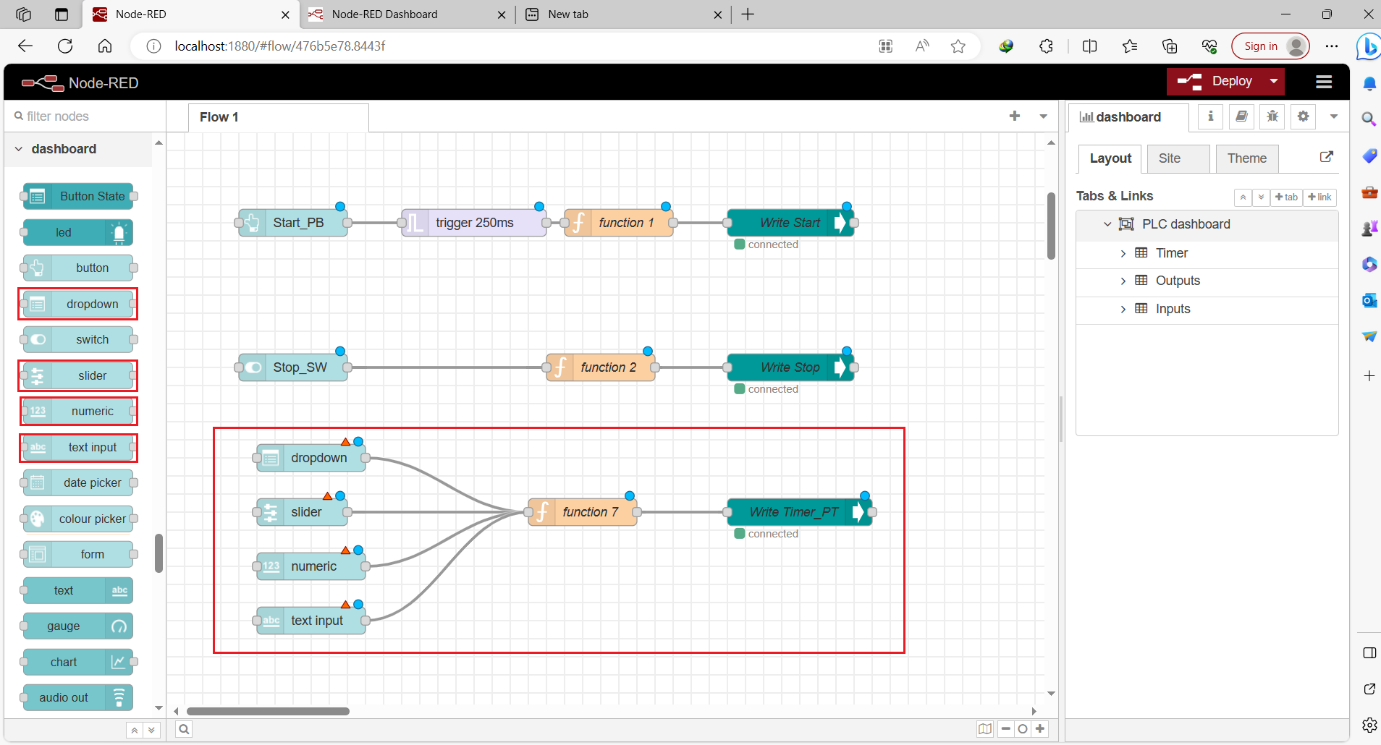
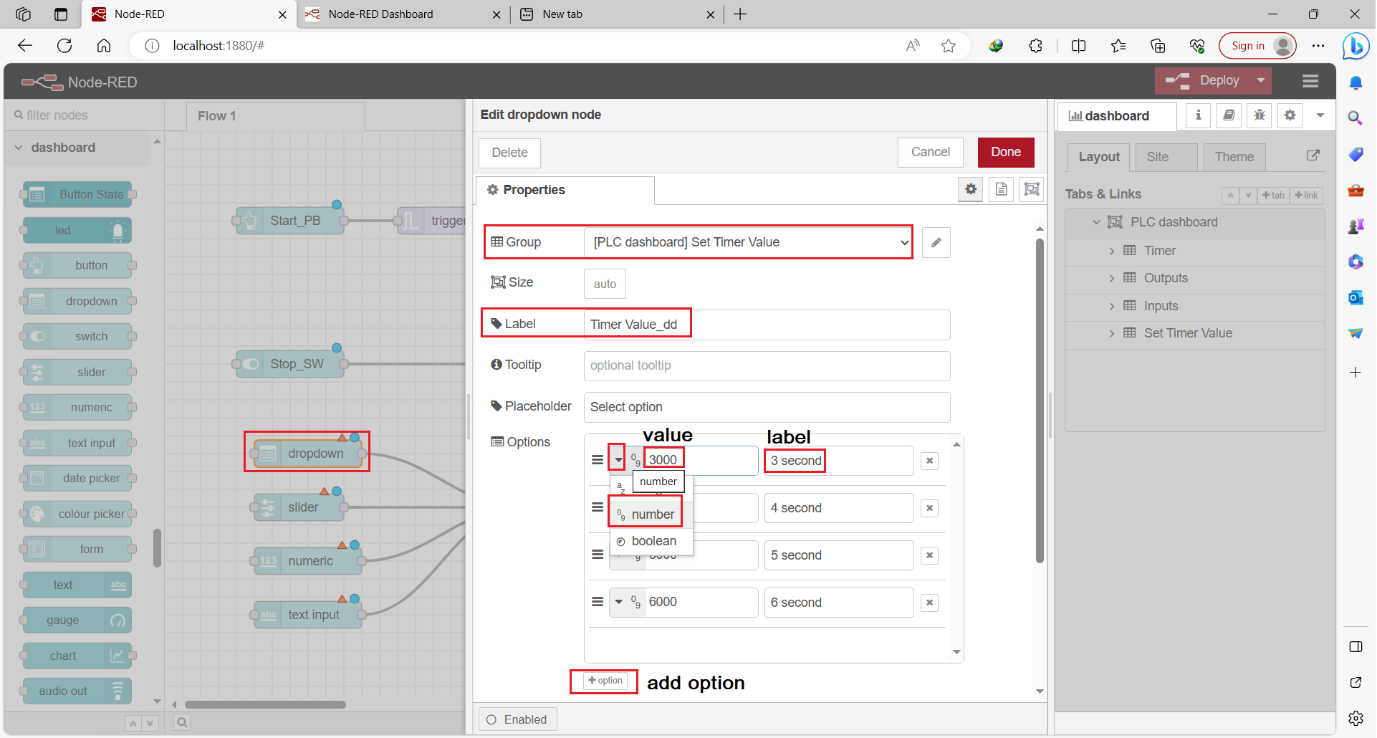
Let's begin with the Dropdown node. Double-click on the Dropdown node to configure its settings. We'll create a new group named 'Set Timer Value' within the same tab as the PLC Dashboard. Next, we'll label it as 'Timer Value_dd.' In the 'Options' section, we find settings for values and labels. When we select an option by its label in our dashboard, it will send the associated value to our Function node for conversion before being sent to the S7comm node. I'll add four options with number datatype (it’s important to choose datatype as a number) : the first with a label of '3 second' and a value of '3000,' the second with a label of '4 second' and a value of '4000,' the third with a label of '5 second' and a value of '5000,' and the fourth with a label of '6 second' and a value of '6000.' Once done, click 'Done' to save the settings.
Now, let's configure the Slider node. Double-click on the Slider node to access its settings. We'll place it in the same group as 'Set Timer Value,' and I'll label it 'Timer Value_S'. In the 'Range' section, I'll select a range from 0 to 10,000 with a step of 1,000. In the 'Output' section, we have two options. The first is 'Continuously while sliding,' which sends data continuously as we move the slider. The second option is 'Only on release,' which sends data once we release the slider. We'll choose the 'Only on release' option for this example. After configuring these settings, click 'Done' to save your changes.

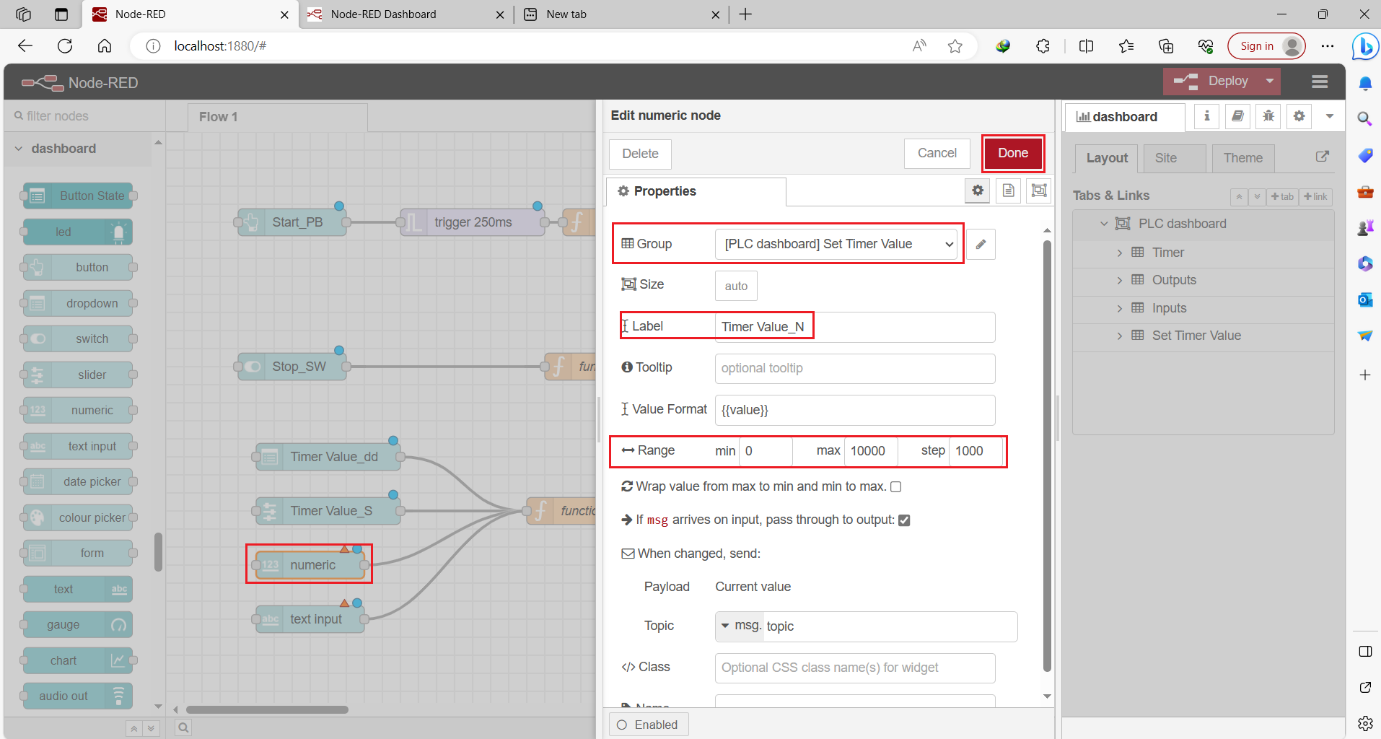
Now, let's configure the Numeric node. Double-click on the Numeric node to access its settings. We'll place it in the same group as 'Set Timer Value' and label it 'Timer Value_N'. In the 'Range' section, we'll select a range from 0 to 10,000 with a step of 1,000. After configuring these settings, click 'Done' to save your changes.
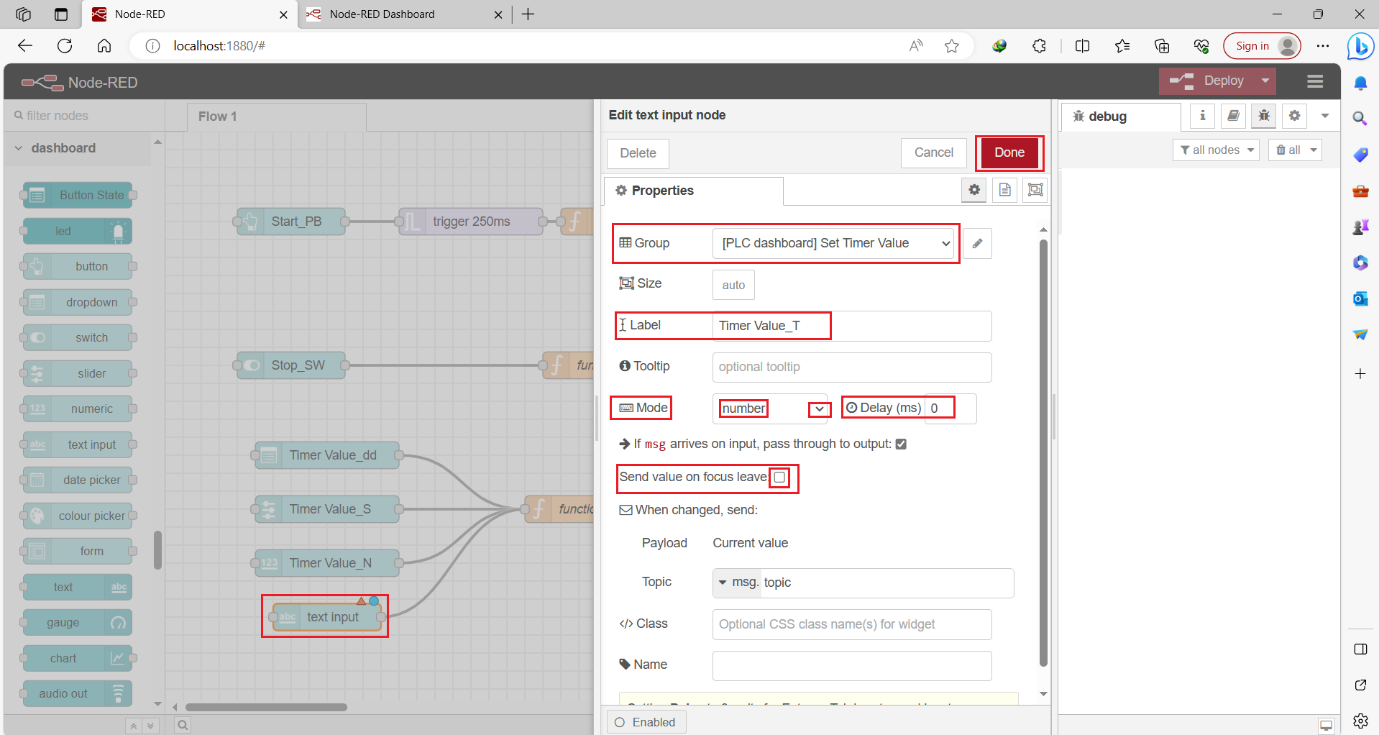
Now, let's configure the Text Input node. Double-click on the Text Input node to access its settings. We'll place it in the same group as 'Set Timer Value' and label it 'Timer Value_T'. In the 'Mode' section, we'll select 'Number mode' which only accepts numeric input. In the 'Delay' section, we'll set a delay that determines when the input will be sent to the output. If we want the input to be sent immediately, we'll set the delay to 0ms. To send data only when we press 'Enter,' we'll set the delay to 0ms and deactivate 'Send Value on Focus Leave.' We'll choose this option. After configuring these settings, click 'Done' to save your changes.
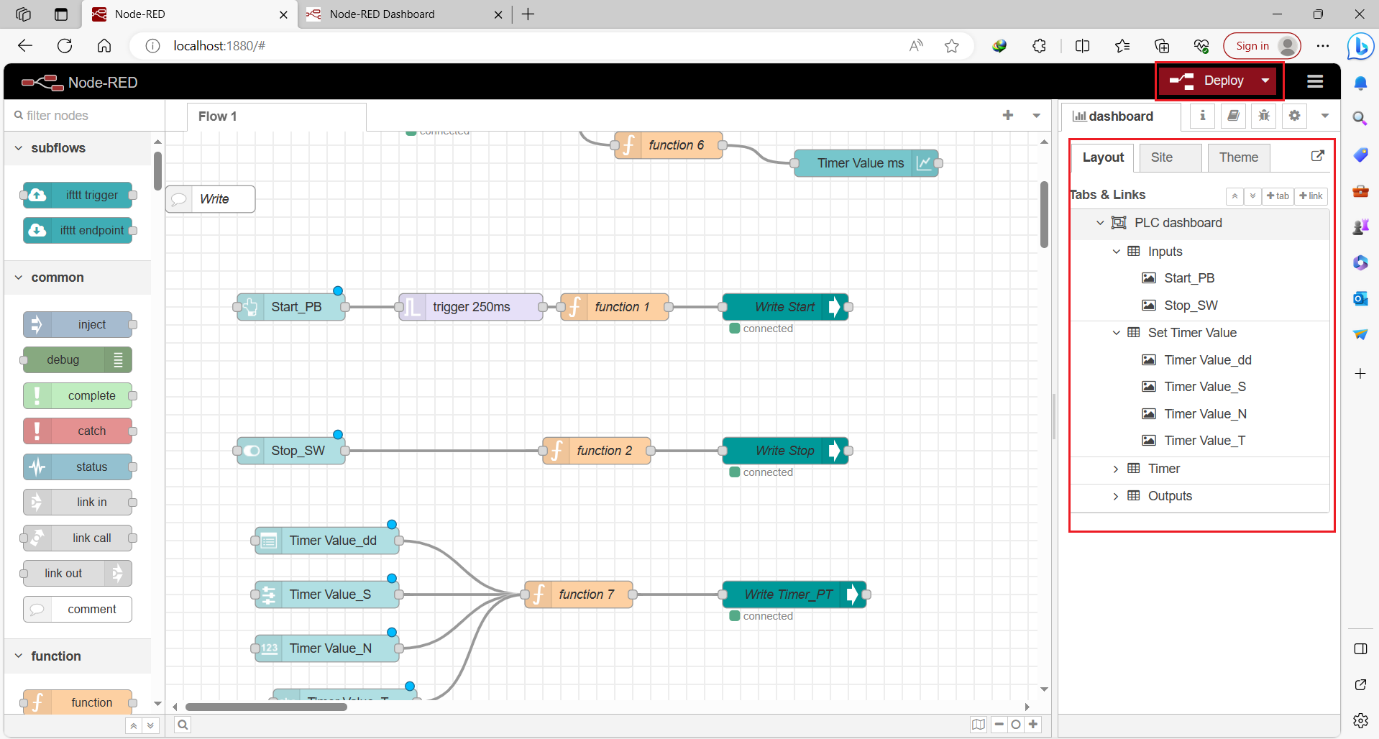
Now, go to the dashboard settings to customize the layout to your preferences, and this will be your final layout After that click 'Deploy' to activate all the changes we've made.
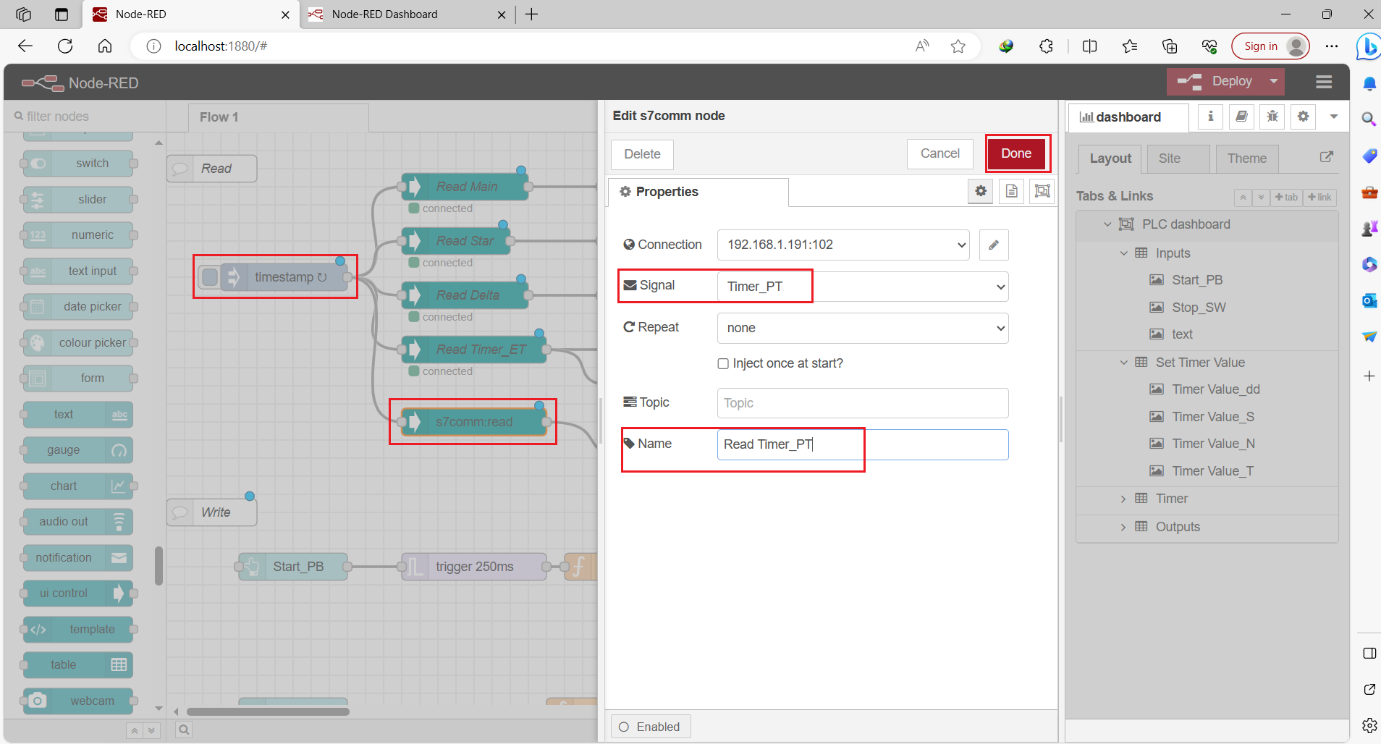
However, we have one remaining issue to fix. We now have four input nodes to send data to our Timer PT tag, and each input node can have a different value. To keep track of the Timer PT tag's current value and resolve this issue, we will use an S7comm Read Node. This node will read and display the current value of our Timer PT tag.
As we've done earlier in this tutorial, we will add a Text Output node to display the value of Timer PT. We'll format the output value as 'msg.payload.value[0]' and place it in the 'Timer' group And we finished !.

Click 'Deploy' to activate all the changes we've made.
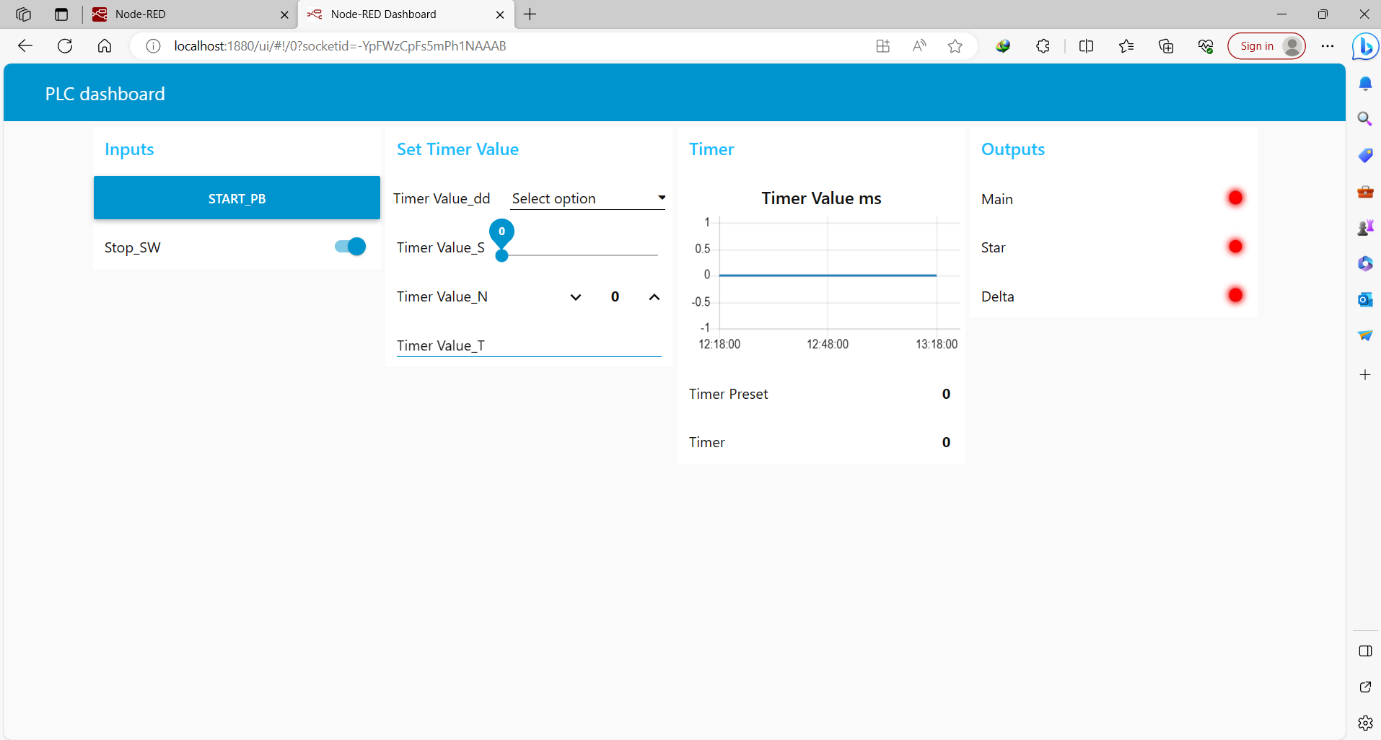
We need to modify the chart node for better display, so double-click on it. Adjust the X-axis settings to record data for the last minute. For the Y-axis, set the range from 0 to 10,000.
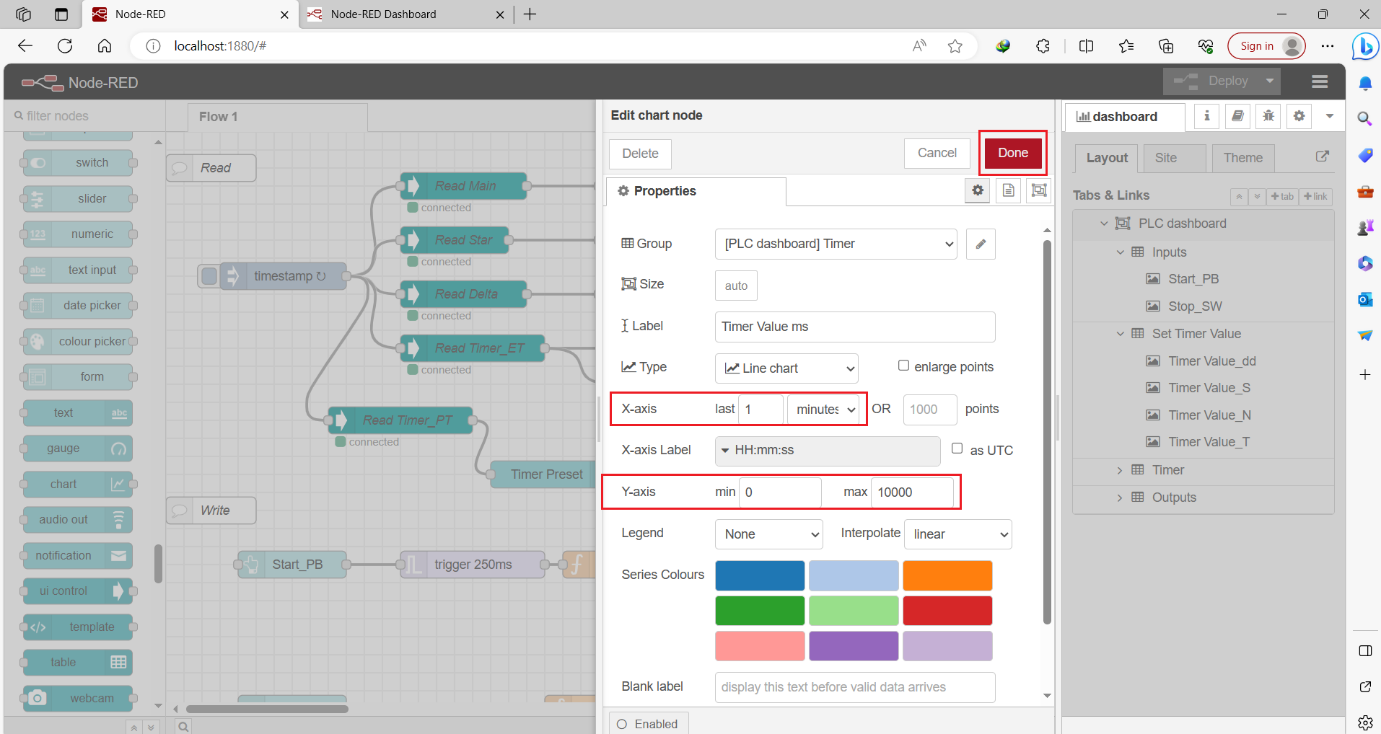
Click 'Deploy' to activate all the changes we've made.

System Overview and Project Files
All the necessary files and a video demonstration of the running system are available here. To access the Flow program, simply download the Flow file. Then, within the Node-RED settings, choose the 'Import' option and upload the downloaded Flow file.
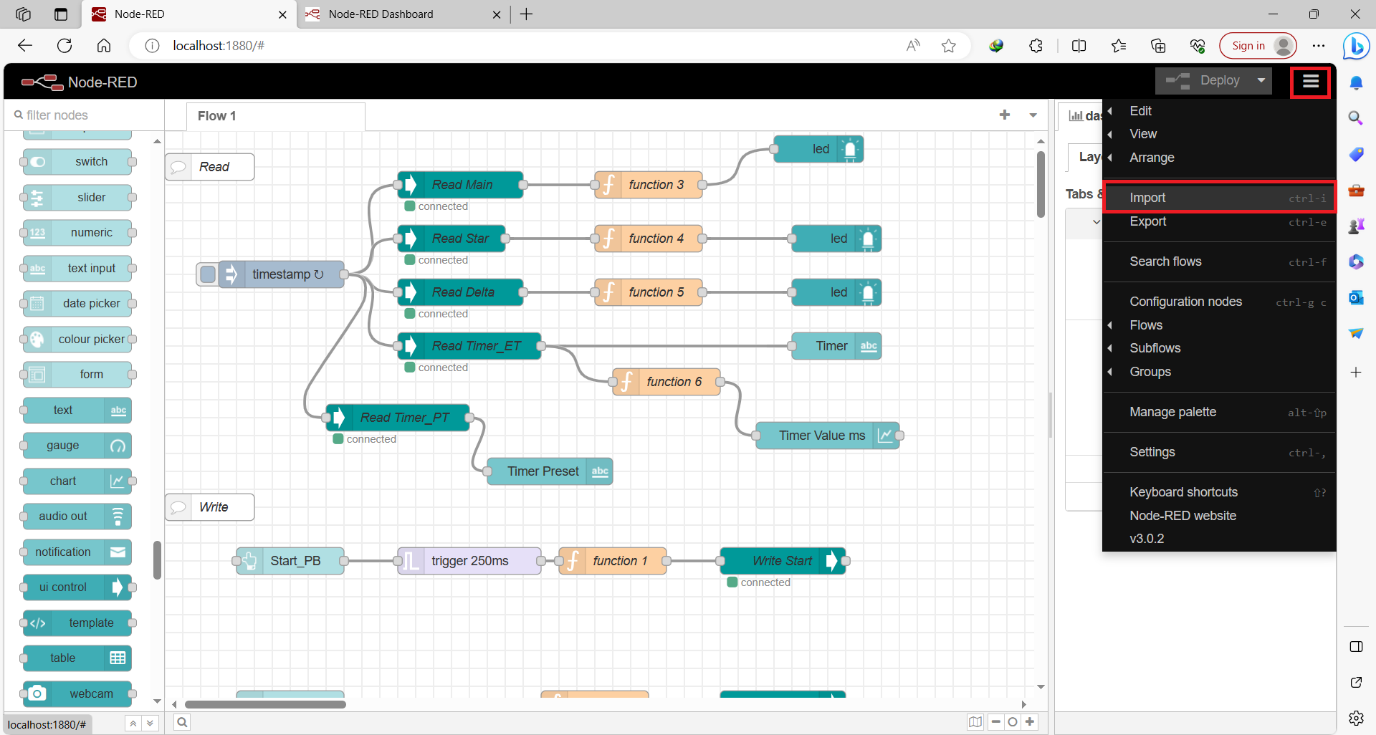
Select your flow
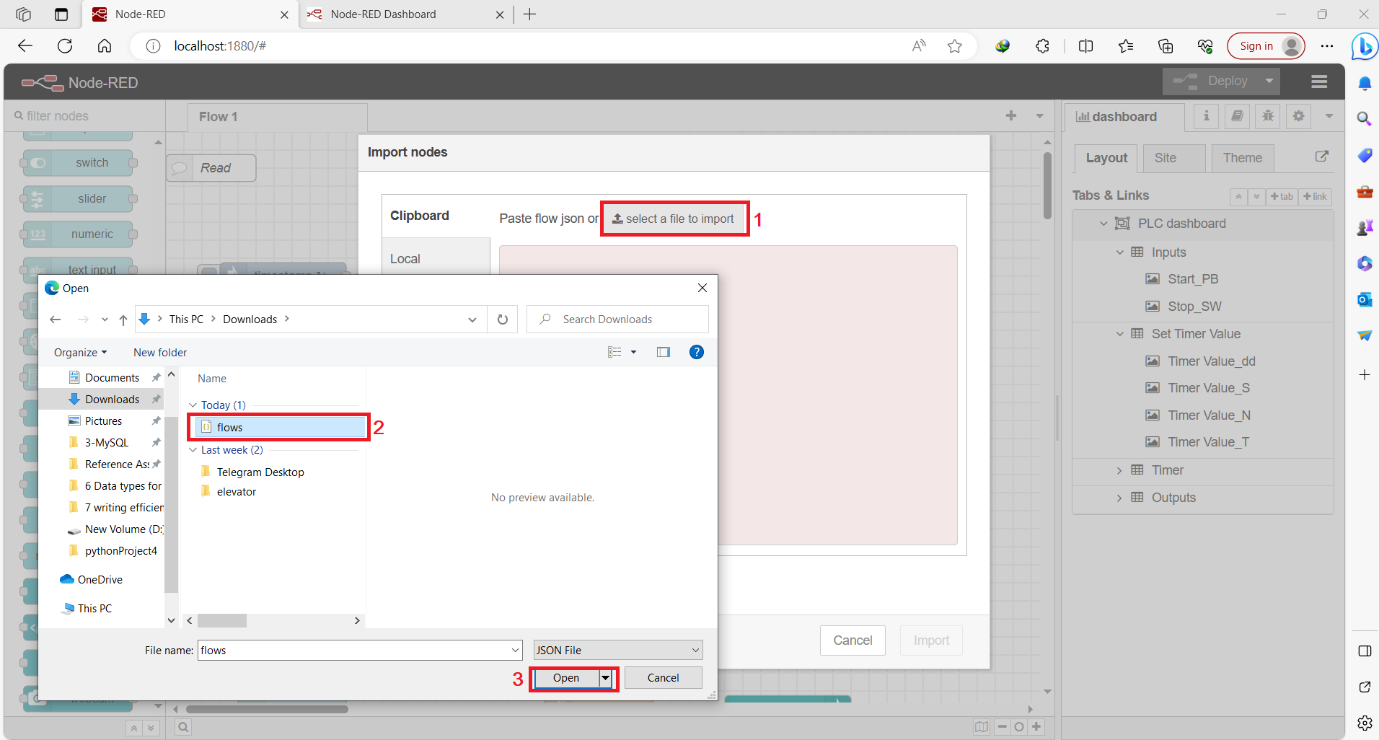
Click import and it’s Done

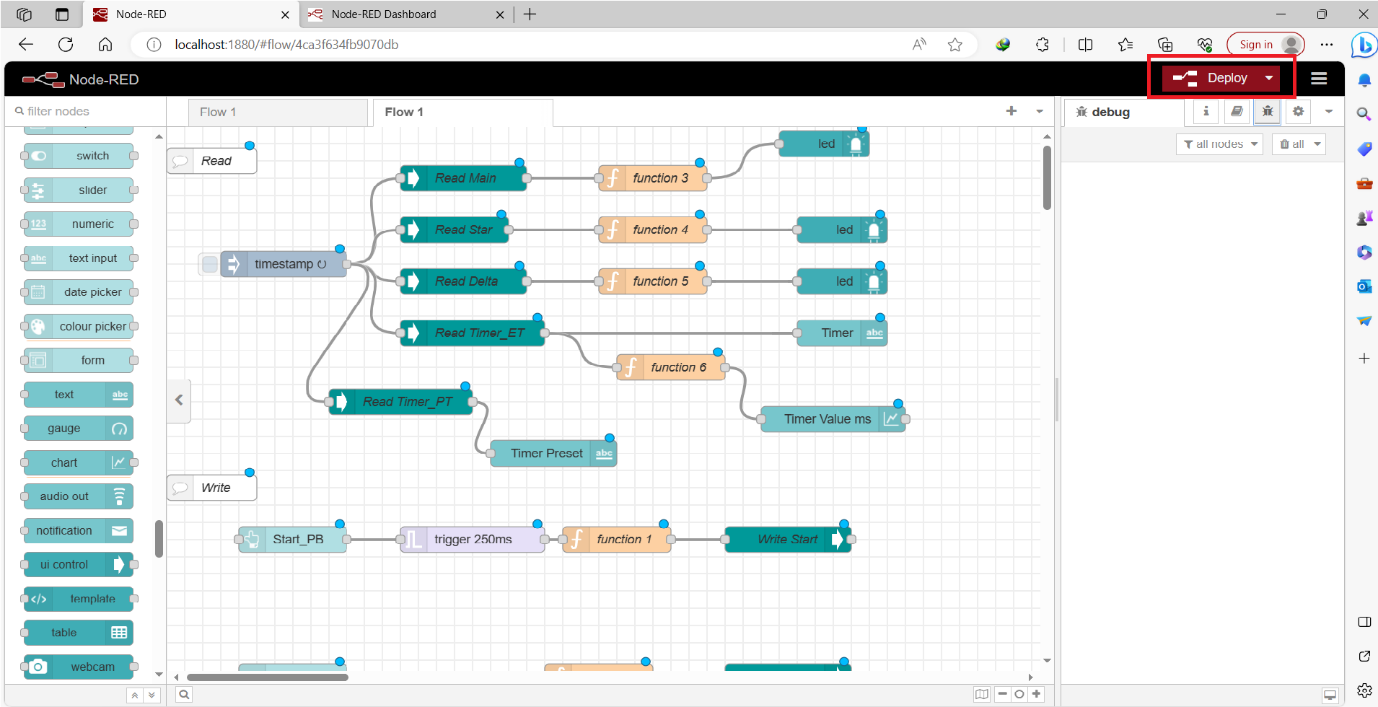
Deploy and have fun
To access the TIA Portal file, follow these steps:
- Open a new project view in your TIA Portal.
- Navigate to the 'Project' menu.
- Select 'Archive'.
- Choose the TIA Portal program file.
Conclusion
In conclusion, this comprehensive tutorial has guided you through the process of creating a Siemens PLC dashboard using Node-RED, empowering you to bridge the gap between physical machinery and digital control systems. By following the steps outlined in this guide, you've learned how to:
- Set up Node-RED, the versatile platform that simplifies automation and digitalization.
- Configure TIA Portal to create a project and CPU, preparing it for communication with Node-RED.
- Set up Net-To-PLC-sim to simulate the PLC behavior without physical hardware.
- Establish communication between Node-RED and the PLC using S7Comm palettes for reading and writing data.
- Create a customized dashboard to monitor and control PLC variables, using a variety of dashboard nodes such as buttons, switches, sliders, and text inputs.
- Display real-time data from the PLC, including Boolean values, timer values, and more, on the dashboard. Write data to the PLC, controlling variables like Start and Stop tags and Timer presets.
- Organize and customize the dashboard layout and appearance to suit your needs. Access system files and video demonstrations for further reference and learning.
By following this tutorial, you've gained valuable insights into the integration of industrial automation and digital control systems, unlocking the potential to optimize processes and enhance efficiency in various industrial applications. With the knowledge and skills acquired, you are well-equipped to embark on your own automation projects and harness the power of digitalization in the industrial sector.


